
34
Weather is what is happening NOW
Warm and cold fronts
A warm front is the boundary where a warmer air mass is moving in to replace a cooler air mass; the air behind a warm front is warmer than the area it is moving into.
A cold front is the boundary where a cooler air mass is moving in to replace a warmer air mass; the air behind a cold front is cooler than the area it is moving into.
Pressure systems
The air pressure on Earth changes throughout the day which affects the weather of an area. A high or low pressure system indicates higher or lower pressure than what is typical for an area. In general, air moves from high pressure areas to low pressure areas.
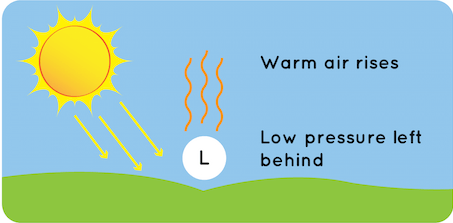
In a low pressure system, there is less pressure on Earth’s surface so air rises. The rising air carries water vapor into the atmosphere which forms clouds and leads to precipitation. As such, a low pressure system is associated with more volatile weather conditions such as clouds, rain, and wind.
In a high pressure system, there is more pressure on Earth’s surface so air descends. Consequently, fewer clouds form. Therefore, the weather is typically sunny and clear in a high pressure system.
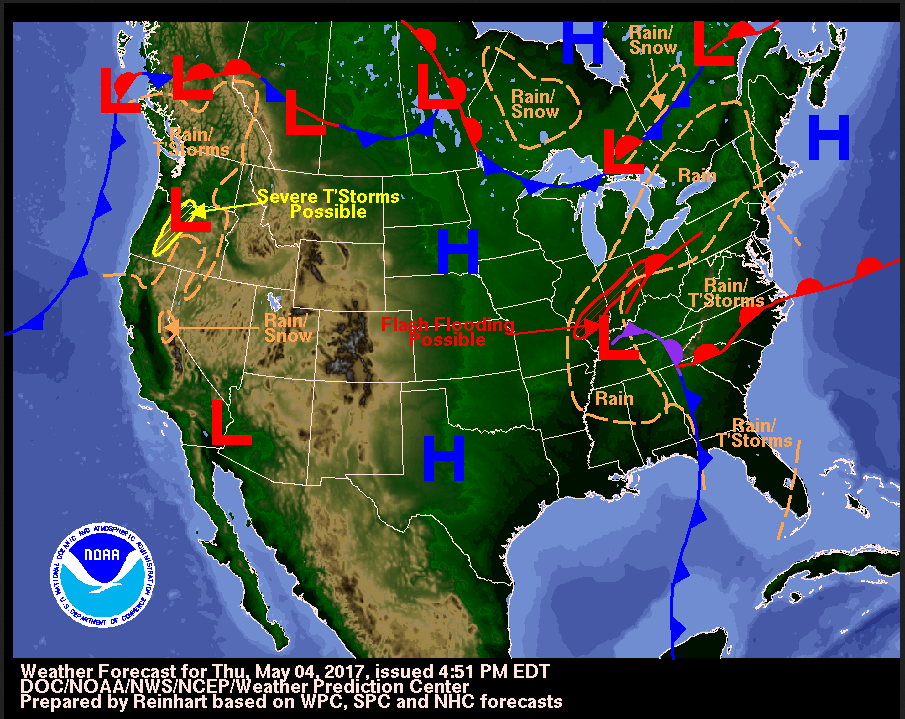
How to Read a Weather Map
A red line indicates a warm front. The circles point in the direction that the front is moving.

A blue line indicates a cold front. The triangles point in the direction that the front is moving.

A line that alternates blue and red indicates a stationary front–an area where a warm and cold front meet, but neither replaces the other.

A blue H is used to indicate a high pressure system. A red L is used to indicate a low pressure system.

On the weather map, below, different symbols are used to indicate weather conditions across the United States.
“Red sky at night, sailor’s delight. Red sky in morning, sailors take warning.”
This saying has been used to predict the weather for many years; similar sayings have even been quoted in the Bible and Shakespeare’s plays. However, this saying is also scientifically accurate.
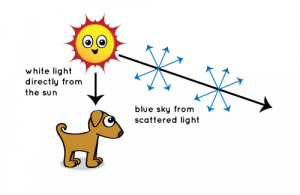
Light from the Sun is made of all the colors of the rainbow. Picture the arc of a rainbow: The red wavelengths on the outside are longer and the blue wavelengths on the inside are shorter. On a typical day, the blue light is scattered and reflected by particles in the atmosphere most efficiently because it travels in shorter wavelengths. This is why the sky is blue.
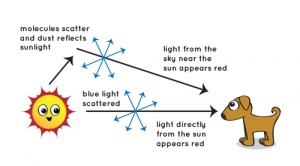
A high pressure system is associated with good weather. However, the air is filled with dust and aerosols because the air is pushed down closer to the surface of Earth. These particles scatter long red wavelengths through the atmosphere more efficiently than blue wavelengths which gives the sky a red appearance at sunrise and sunset.
“Red sky at night, sailor’s delight.”
In the middle latitudes, between 30 and 60 degrees, weather generally moves from west to east. The Sun sets in the west, so a red sky at night indicates that good weather will be moving toward you the next day.
“Red sky at morning, sailors take warning.”
The Sun rises in the east, so a red sky in the morning indicates that the good weather has already passed. Therefore, a low pressure system, and bad weather, will likely be moving in next.
K-6 Standards
K-ESS2-1. Use and share observations of local weather conditions to describe patterns over
time.
K-ESS3-2. Ask questions to obtain information about the purpose of weather forecasting to
prepare for, and respond to, severe weather.
3-ESS2-1. Represent data in tables and graphical displays to describe typical weather
conditions expected during a particular season.
3-ESS3-1. Make a claim about the merit of a design solution that reduces the impacts of a
weather-related hazard.
Water Cycle
Although it may seem to change, the amount of water on Earth is actually constant. However, the water’s physical state and its location change in a process called the water cycle.

Watch the video, below, for a review of the water cycle.
Video credit: “Earth’s Water Cycle” by NASA Goddard is public domain
Key Terms in the Water Cycle
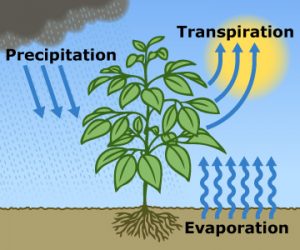
- Liquid water evaporates from Earth’s surface or bodies of water and enters the atmosphere as a gas called water vapor.
- Water vapor condenses into tiny liquid water droplets which form clouds.
- The water droplets combine into larger drops and precipitation such as rain occurs.
- Sometimes, water in clouds skips the liquid precipitation phase and goes straight from water vapor to solid form. This process, called desublimation, results in snow. The opposite of desublimation is sublimation, where water changes straight from its solid state to gas. This process is difficult to visualize in the water cycle, but it is the same process that occurs with dry ice–when exposed to air, carbon dioxide from solid dry ice is released in the form of gas through sublimation.
- When precipitation hits the surface of Earth, it becomes surface runoff. The water flows over the land and reenters bodies of water such as lakes, rivers, and oceans. where it will eventually evaporate again, thus continuing the water cycle.
- Some water will infiltrate the ground, becoming groundwater that can seep into aquifers.
- Precipitation can also evaporate from the surface of the land. Or, plants can absorb water through their roots. The water moves through the plant and is released through the plant’s leaves where it can evaporate back into the atmosphere. This process is called evapotranspiration.
For more explanation of the terms, watch the following video from Khan Academy:
Video credit: “The Water Cycle” by Khan Academy is licensed under CC BY-NC-SA 3.0. Note: All Khan Academy content is available for free at khanacademy.org.
Wind
Wind is caused when Earth’s surface is heated unevenly by the Sun. Different types of surfaces on Earth, such as land or water, absorb heat differently. Additionally, darker-colored areas absorb more heat than lighter-colored surfaces. Finally, Earth is tilted on its axis so the Sun hits certain areas of the surface more directly than others which causes temperature differences. All of these factors contribute to the uneven heating of Earth’s surface.
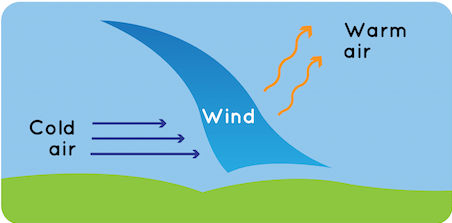
Remember that warm air rises and cool air descends. When warm air rises, it leaves a low pressure area behind. In order to maintain balance, air from a cooler, high-pressure area moves in to fill the space and wind occurs.
| K-ESS2-1. | <span class="popup" style="cursor: pointer" title="" data-original-title="
Analyzing and Interpreting DataAnalyzing data in K–2 builds on prior experiences and progresses to collecting, recording, and sharing observations.
“>Use and share observations of <span class="popup" style="cursor: pointer" title="" data-original-title=" ESS2.D: Weather and Climate
“>local weather conditions <span class="popup" style="cursor: pointer" title="" data-original-title=" Patterns
“>to describe patterns <span class="popup" style="cursor: pointer" title="" data-original-title=" ESS2.D: Weather and Climate
“>over time. [Clarification Statement: Examples of qualitative observations could include descriptions of the weather (such as sunny, cloudy, rainy, and warm); examples of quantitative observations could include numbers of sunny, windy, and rainy days in a month. Examples of patterns could include that it is usually cooler in the morning than in the afternoon and the number of sunny days versus cloudy days in different months.] [Assessment Boundary: Assessment of quantitative observations limited to whole numbers and relative measures such as warmer/cooler.] |
|---|
| -ESS2-2. | <span class="popup" style="cursor: pointer" title="" data-original-title="
Developing and Using ModelsModeling in K–2 builds on prior experiences and progresses to include using and developing models (i.e., diagram, drawing, physical replica, diorama, dramatization, or storyboard) that represent concrete events or design solutions.
“>Develop a model to represent <span class="popup" style="cursor: pointer" title="" data-original-title=" ESS2.B: Plate Tectonics and Large-Scale System Interactions
|
|---|
kindergarten
ESS2.D: Weather and Climate
second grade
ESS2.C: The Roles of Water in Earth’s Surface Processes
The short term atmospheric conditions in an area.
A large body of air that takes on the climatic conditions of the area where it is formed.
Air pressure on Earth is higher than normal, so air descends. A high pressure system is associated with good weather--sunny and clear skies.
A location's distance from the Equator.
Air pressure on Earth is lower than normal, so air rises. A low pressure system is associated with bad weather--clouds, rain, and wind.
Process of how water in different states continuously moves on, above, and below Earth's surface.
Process by which water changes states from liquid to gaseous water vapor.
Process by which water changes states from water vapor to liquid water.
Heavier water droplets condense and fall from clouds to Earth's surface in the form of rain, snow, or hail.
Process by which water vapor (gas) converts straight to solid form, resulting in snow.
Process by which water changes straight from its solid state to gas. This is the same process that occurs with dry ice--when exposed to air, carbon dioxide is released in the form of gas through sublimation.
The process by which surface water soaks into the ground.
An underground area of rock that stores groundwater. Humans often pump out groundwater from aquifers or use them as a source for wells.
Process by which water evaporates from the surface of the land or from plant's leaves.