
II. Chemical Foundations
A. Nano Matters
In science, it is often important to question your assumptions. For example, consider this: is the melting point an extensive or an intensive property? You will recall that an extensive property is one that depends on the quantity of matter in a given sample and an intensive property is one that does not depend on the amount. It is tempting to say that melting point is an intensive property, but is it really? What if you take it to the extreme? The melting point of one atom is not really a useful concept since melting is a property that depends on the interactions between atoms and molecules. But how many atoms or molecules do you need before you have a “bulk sample?” Let’s examine this question by looking at the experimental evidence. Figure 1 shows the experimental dependence of the melting point of gold particles as a function of size.
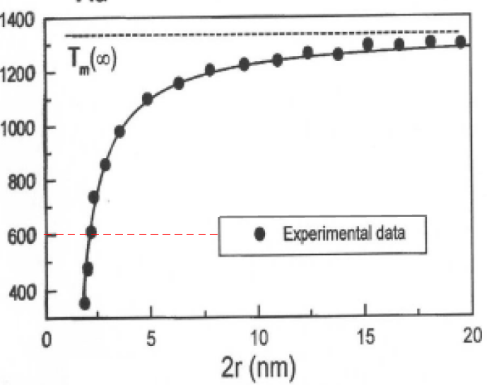
You can clearly see that for very small gold particles, in the nanometer size regime, the melting point is significantly affected by the size of the sample. One consequence of this behavior is that if you can precisely control the size of a material, you can often selectively tune the properties of the material to achieve heretofore unprecedented results. This is the promise of nanotechnology. By carefully controlling the fundamental building blocks of materials at the level of the nanoscale, scientists can achieve amazing control and obtain properties that to date have not been possible.
B. Light
In case study and lab, you will focus primarily on the properties of light and its interaction with the nanoparticles as a function of size; therefore, it is important to understand light and how light can be used to probe matter and quantum mechanics. There are two descriptions of light that are useful for understanding its nature. The first is that light has many wave-like properties. In this description, light is often categorized by its wavelength; wavelength is defined as the distance between two adjacent peaks in the waveform.
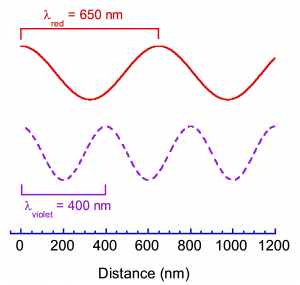
Within the visible region of the electromagnetic spectrum, each wavelength has an associated color. For example, consider a plot of the electric field of light versus distance for red light and for violet light, as illustrated in Figure 2. In this plot, it is evident that red light has a longer wavelength than violet light and that the wavelength of red light is about λ=650 nm while the wavelength of violet light is about λ=400 nm. It is important to remember this trend: in the visible spectrum, the wavelength decreases going from red to violet (ROYGBV).
The second useful description of light is as bundles of energy called photons. Since wavelength and energy are just two alternate descriptions of the same light, there is a relationship between these two descriptions. Mathematically, it is found that the energy of light is inversely proportional to the wavelength, and more specifically, energy is related to wavelength by the following equation:

In addition to the energy, E, and the wavelength, λ, you will see that there are two additional constants in this expression. Plank’s constant, h, is a fundamental constant associated with the quantized nature of matter and has a value of 6.63 x 10⁻³⁴ J·s, and the speed of light, c, is the speed that light travels in a vacuum and has the value of 3.00 x 10⁸ m/s. From this expression, you can calculate the energy of a red photon as:

or similarly the energy of a violet photon can be found to be:

You should notice that the spectral trend in the visible spectrum is that the energy increases going from red to violet. This trend is of course no surprise since you know the trend presented earlier for wavelength, and you know that wavelength and energy have an inverse relationship.
C. Spectroscopy
In your experimental investigations of nanocrystalline materials, light will be one of your most powerful tools. The key idea is that there is a cause and effect relationship between the energy of a photon and the energy of a transition between quantized electronic energy states. For example in your laboratory investigation, you will find that visible light is produced when electrons lose energy. Since by the First Law of Thermodynamics you know that energy is conserved, it should not surprise you to find that the energy lost by an electron is equal to the energy carried away as a photon. When light is produced in this way, it is said that the light is emitted by an electronic transition.
The reverse of the emission process is called absorption. During the process of electronic absorption, a photon interacts with an electron, and the energy of the photon can be absorbed to increase the energy of the electron. This process annihilates the photon and creates a more energetic electron. When light is used in this way, it is said that the light is absorbed by an electronic transition.
This direct relationship between the differences between electronic energies and the energy of photons is an extremely powerful tool in the study of quantum mechanics, and it is the basis of a widely used experimental method known as optical spectroscopy. In spectroscopy, the interaction of light and matter are measured, and these methods are capable of providing insight into the quantum nature of materials.
You have already seen an example of this during your studies of Unit 2 Module 1. In the case of the hydrogen atom, one of the most direct experimental probes of the energy differences between electronic energy levels is to measure the light that is given off by energetically excited hydrogen atoms. The range of light that is given off is known as the spectrum, and it is directly correlated to the differences of the energy states in which the electron can be found. This idea is illustrated in the figure below.
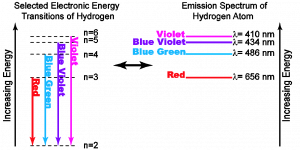
On the left hand side of this diagram, you can see an energy level diagram of the hydrogen atom. In this diagram, the vertical axis presents the energy scale and each horizontal line represents an accessible energy state of the electron in the hydrogen atom. Recall that within the energy range shown, the electron can ONLY have one of the energies represented by the horizontal line (labeled with the quantum number, n).
For an isolated atom, the only way for an electron to change its energy is by emitting (or absorbing) a photon. The result is that by detecting the energies of the emitted light, the energy differences between electronic states are directly revealed.
D. LEDs (Light-Emitting Diodes)
Atoms are not the only things to have quantized energy levels. The properties of semiconductors also rely on the quantum mechanical properties of nature, and we can apply quantum mechanical models to gain insight into their interesting properties.
For example, LEDs (light-emitting diodes) are semiconducting devices that produce light using electrical energy from a battery or power supply. The green “ON”-light on most computer monitors is usually a LED. These devices produce light as electrons pass through an electrical circuit and pass between quantized energy levels (called bands).
To gain a basic understanding of how semiconducting devices can produce light, it is useful to use a simple model. This model is sufficient to explain most of the observations that you will make using these devices; however, keep in mind that this model, and like all models, is only a simplified view of a complex reality. As long as you keep this caveat in mind, there is much that can be learned by using such a model.
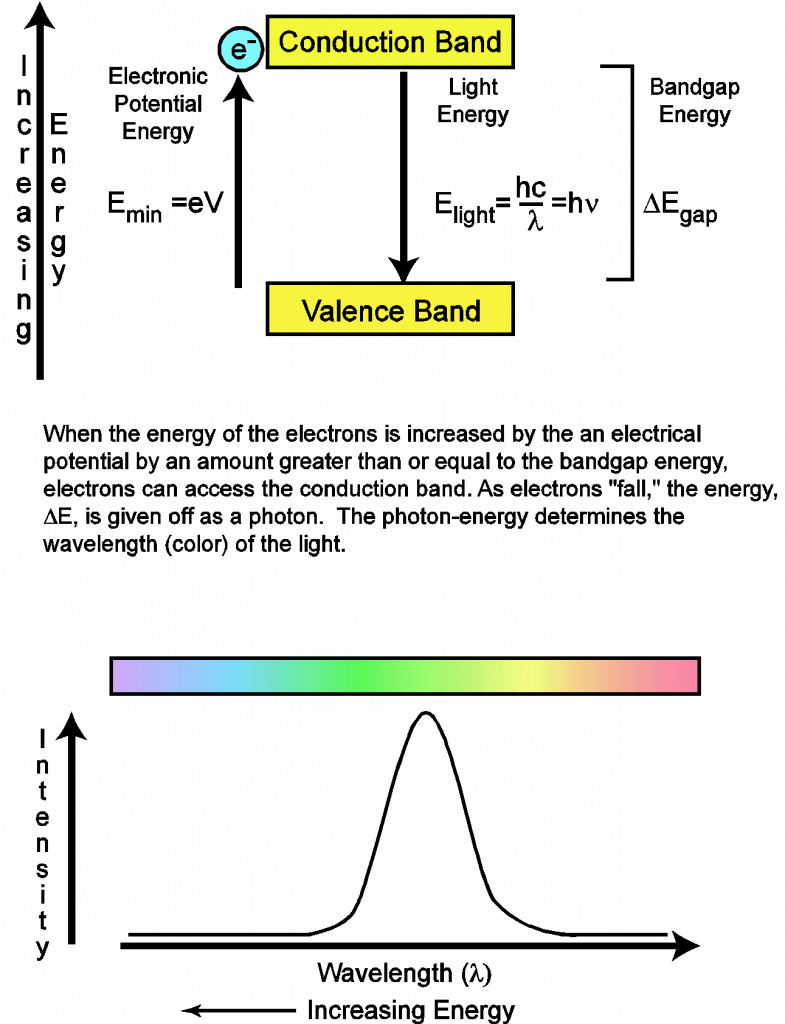
In this simple model (illustrated in Figure 4), a semiconductor will be supposed to have two electronic energy bands. Bands are collections of energy levels and therefore have some distribution of energies. The upper energy band is called the conduction band and the lower energy band is called the valence band. The energy difference between the upper energy band and the lower energy band is known as the band gap energy. Since the valence band is the lowest energy band available, an electron in this band cannot lose energy. The result is that no light can be produced by an electron in the valence band. For an LED to produce light, it is necessary to have an external power source, such as a battery. This power source provides the electrical potential (measured in volts) necessary to produce an electron with sufficient energy to access the upper energy band. Since the electron is charged, its energy due to the electronic potential is given by the equation:

where q is charge (in coulombs), V is the potential (in volts), and e is the magnitude of charge of an electron. From this equation, it can be recognized that the LED will turn on when the potential reaches a minimum voltage (Vmin) such that the following condition is satisfied,  . The value of the electrical potential just sufficient to turn on the LED is often called the threshold voltage.
You should now be able to apply this model to not only explain how LEDs produce light, but you should also be able to predict the color of light if you are given the band gap energy of the semiconductor. The key result is that for each electron that “falls” from the upper energy band to the lower energy band, the energy lost (Egap) will be carried away as a photon; thus Egap = Ephoton. Therefore, it also follows that the magnitude of the band gap energy determines the color of the light that is emitted by the LED.
E. Semiconductor Fluorescence
Power supplies are not the only way that the electrons of semiconductors can gain energy; energy can also be provided by absorbing a photon of sufficient energy. When will a semiconductor absorb a photon? The energy of the photon can be absorbed if its energy is sufficient to “lift” an electron into the conducting band. Therefore, the minimum energy necessary is the band gap energy. However, photons with energies greater than the band gap energy can also be absorbed due to the fact that the conduction band has a distribution of energies (in the model, this is represented by the fact that the conduction band is presented as a box with some width rather than a simple line.)
The next question is, “what happens to the electron once it goes into the conduction band?”
The simple answer is that it eventually loses its energy, but in a very interesting way; it can give off light by fluorescing. The mechanism of this fluorescent process is an electron that is lifted to an energy above the bottom of the conduction band can lose energy within the conduction band by giving off thermal energy (heat). This process can continue until the electron obtains an energy near the bottom of the conduction band. At this point, the electron can lose its remaining energy by emitting a photon. Due to this process, the energy of light that is emitted by fluorescence is equal to the band gap energy. In the case of the nanocrystals that you will investigate, you will be able to irradiate the samples with violet light, and the samples will fluoresce in different colors depending on the band gap energy of the nanocrystal. This process is schematically illustrated in Figure 5 below.

F. “Squeezing electrons”
Now the final question becomes, “does size matter?” All matter has certain wave-like characteristics and that for small particles of low mass, there are many physical phenomena that can be traced to these characteristics: photoelectric effect, atomic emission spectra, and chemical bonding, to name a few.
In trying to gauge the impact of this wave-like behavior, scientists sometimes use a model known as a particle in a box. This model is a simple one; however, it can be useful to help think about why size might matter at the nanoscale. To begin, suppose that an electron is placed into a box with a very hard wall, so that it cannot leave the box (see Figure 6.) One of the lessons of quantum mechanics is that due to the wave-like nature of the electron, the probability of finding the electron at a specific location is spread over the entire box, i.e. the electron is a wave. Further, quantum theory provides a mathematical expression to determine the wave functions (called orbitals in the case of atoms and molecules) of the electron and the associated energies. The mathematical solutions to this problem show that the electron can only take on certain waveforms and that each waveform can be labeled according to its energy. The mathematical expression for the lowest energy and wave function is given as:

and

Here, Ebox is the energy of the lowest level (n =1), h is Planck’s constant, m is the mass of the electron and L is the length of the box. From this expression, it should be recognized that (1) the electron cannot have zero energy since n=1 defines the minimum value of energy and that (2) the energy depends on the inverse square of the size of the box, L. The conclusion is that with this model we find that the lowest energy available depends on the size of the box!
Now consider an example. What if an electron is confined to a one-dimensional “box” with a length of 1 nm? In this case, the electron cannot rest at the bottom of the box, but rather must have a value of about 0.6×10⁻¹⁹ J above the bottom. However, the situation changes drastically with an electron in a 10 nm box. If the box is L=10 nm, the lowest electron energy is about 0.006×10⁻¹⁹ J, which compared to the energy of visible light is insignificant and can be pictured as very close to “the bottom of the box.” These examples are illustrated in Figure 6 below:

To put this in perspective, recall that a red photon has an energy of 3×10-19 J. Therefore, the simple model of an electron in a nanometer box clearly suggests that size might be significant when objects have nanometer dimensions. The key idea here is that the minimum energy of the electron increases as it is confined. Colloquially, I can say that an electron’s energy can be increased by “squeezing the electron.”
Although the model is oversimplified, it provides a “hypothesis” that is testable. Can you change the size of a semiconducting material and affect the energy of its electrons? Addressing this question will be one of your objectives during your laboratory activity next week.
G. Combining Ideas
By combining the idea that fluorescence in semiconductors can be used to measure the band gap energy of the materials and the idea of an energy of “squeezing” or confining electrons should impact the effective band gap of nanosized semiconductors, the picture that emerges might be illustrated as displayed in Figure 7, below.
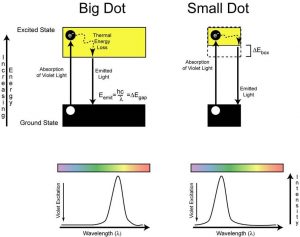
In this picture, it can be realized that as the electron is confined (symbolized as ΔEbox in the energy diagram), the excited state energy is increased above the ground state energy, effectively increasing the band gap energy. This has the consequence of moving the absorption onset (minimum energy of light where the sample begins to absorb energy) to higher energy, and similarly the light emitted in fluorescence also moves to higher energy (it shifts towards the violet).
