
V. Laboratory Activity
Preparation
- Complete case study and pre-lab activities.
- Read all of lab Topic 9.
- Read and understand Unit 5 Module 4.
Do this before you come to lab (have at the top of your notebook page to begin the lab):
- Safety: Answer the following questions:
- For a concentration of hydrogen peroxide of 3-6%, what is the NFPA rate of reactivity based on SDS sheet for hydrogen peroxide?
- What is the risk/concern if the 3-6% hydrogen peroxide is spilled on your skin?
- Purpose: Write a few sentences about the purpose of this lab: What is the “big picture” viewpoint of the lab experiment? What question am I trying to answer? What data will be collected to answer the questions? What technique will I use to obtain these data?
- Preparation: What are the steps necessary to complete this experiment? Make a hypothesis about what variables will lead to the fastest rate of reaction.
A. Introduction
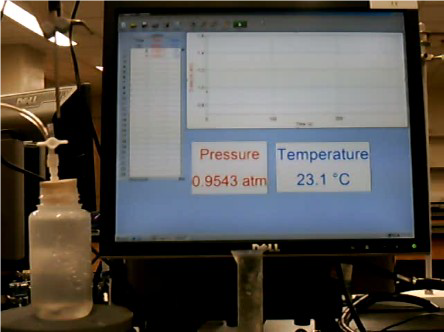
Since the decomposition of hydrogen peroxide produces oxygen gas as one of the products, the rate of gas formation can be used to measure the rate of the reaction. Experimentally, you will measure the gas by monitoring the pressure of gas within a sealed reaction vessel as a function of time. To accomplish this, you will set up a plastic reaction bottle and attach a tube to a gas pressure sensor (and a temperature sensor). The sensors are connected to a computer and the data will be displayed as shown in the figure below.
From the pressure change of gas per second, the rate of the reaction can be obtained. Reaction rates are usually given in units of molarity per second, and these are the units that should be used when reporting your final results.
As explained in case study, you will first explore different catalysts that are known to be effective at promoting the rate of the decomposition reactions. Aqueous iodide ions will be used as an example of a homogeneous catalyst, and manganese(IV) oxide will be used as a heterogeneous catalyst.
B. Your Laboratory Challenge
Your TA will help you to set up the apparatus and make sure that you are able to make a measurement. After that, the rest is up to you.
Part 1: Calibrating:
Measure 25 mL of water into the plastic bottle, add a magnetic stir bar, and stopper the bottle with the stopper that is attached to the pressure sensor. To launch the program, select Desktop → 412 → Gas Kinetics. Once the LoggerPro program displays, record the room pressure and temperature in your notebook.
Atmospheric Pressure = ______________ Room Temperature = ___________
Use your data to calculate the number of moles of gas in a 20. mL syringe under these conditions. Then calculate the equivalent solution concentration, in units of molarity, by dividing the moles of gas that you just calculated by the volume of the water used.
Open the stopcock on the stopper and start the data acquisition by clicking on the Collect button. Measure out 20 mL of air into a syringe, attach and twist the syringe to form a gas-tight seal, inject the air, and close the stopcock. While you wait for the pressure reading to stabilize, remove the syringe, re-load it with another 20 mL of air, and re-attach it to the stopcock. Once the pressure has stabilized, open the stopcock, inject the 20 mL of air, and close the stopcock. Repeat this process for one more 20 mL aliquot of air. Stop the data acquisition and record the four levels of pressure observed using the Statistics
graph tool button. Calculate the average pressure change caused by 20 mL of air.
Experimentally, you have just defined an equivalence between the pressure change caused by addition of 20 mL of gas to the equivalent amount in units of molarity,
[air concentration] = average Pressure change × CF,
where CF stands for the conversion factor to transform pressure units to concentration units. Use your data to calculate CF in units of M/atm.
Then, you will use this CF to convert pressure data, which may be accomplished with the software as follows. To calculate a new column, based on this conversion, in Logger Pro go to the Data menu → New Calculated Column, then type the name as concentration, short name [O2], and units as M. Select variable Pressure
and multiply it by your CF, select Display during live readouts, and then click Done. Finally, click on the y-label that reads as pressure
. This will bring up a menu on which you will select concentration. The graph will now read concentration vs. time.
If you want to start from a zero concentration, go to the Experiment
menu and select Zero to zero the sensor at any point.
Part 2: Initial Experiments:
For the initial experiments, you will perform the seven experimental runs outlined in the table below by mixing the appropriate amounts of 4.4% hydrogen peroxide (H2O2) solution, distilled water and catalyst. All experimental runs contain the same amount of total solution.
To perform an experimental run, pour the desired volume of 4.4% hydrogen peroxide solution into a 250-mL plastic bottle, add a stirring bar, set the bottle on the stirring plate, and begin to stir. Start each kinetic run by pouring the appropriate distilled water/catalytic solution/solid into the bottle of hydrogen peroxide solution (this marks time =0 when you click on the collect button of the data acquisition software). Stopper the flask. Monitor the progress of the reaction by measuring the pressure. Your data table should resemble the example one below. You will want to systematically determine the reaction rate for each variable, changing only 1 variable at a time.
An appropriate measurement should see a consistent increase in the concentration of O2 over the course of 5-10 seconds. Three measurements should be conducted per experiment. The change in concentration over time is represented by the slope. The slope of any part of a data set may be obtained by selecting the data (click, drag, and release) and then using the “linear fit” tool.
You should present your results in an appropriate manner (e.g. graph, table, etc.).
| Kinetic Run | Volume of H2O2 (in mL) | Volume of Distilled Water (mL) | Amount of Catalyst | Solution total (mL) | Initial Rate of Reaction |
| 10 mL with no catalyst | 10.0 mL | 15.0 mL | 0.0 mL | 25.0 mL | |
| 10 mL with 0.5 M Iodide solution | 10.0 mL | 10.0 mL | 5.0 mL 0.5 M I– | 25.0 mL | |
| 10 mL with 1 M Iodide solution | 10.0 mL | 10.0 mL | 5.0 mL 1.0 M I– | 25.0 mL | |
| 5 mL with 1 M Iodide solution | 5.0 mL | 15.0 mL | 5.0 mL 1.0 M I– | 25.0 mL | |
| 20 mL with 1 M Iodide solution | 20.0 mL | 0.0 mL | 5.0 mL 1.0 M I– | 25.0 mL | |
| 10 mL with 0.25g MnO2 | 10.0 mL | 15.0 mL | 0.25 g MnO2 | 25.0 mL | |
| 10 mL with 0.5g MnO2 | 10.0 mL | 15.0 mL | 0.5 g MnO2 | 25.0 mL | |
| Choose the different variables to find the best conditions. | |||||
Part 3: DESIGN An Experimental Run:
For the final part of this experiment, your task is to find the set of conditions that produces the fastest rate of decomposition of hydrogen peroxide. Perform an experiment by altering a variable of your choice: concentration of hydrogen peroxide, type of catalyst, and amount of catalyst. All solutions should have a total volume of 25.0 mL. To change the concentration of H2O2, you can use various volumes (5, 10, or 20 mL) of the stock 4.4% H2O2 solution and dilute to 25.0 mL with either water or catalyst solution. The available catalysts are heterogeneous MnO2 solid or homogeneous I– solution.
C. Communicating Your Results
For a permanent record, both your data and report should be written in your notebook.
- Safety
- Purpose
- Preparation
- To summarize the data, observations, and calculations section, be sure that you include all of the following in your lab report:
- Record data and show calculations carried out in the calibration step.
- Record the concentration of the solutions that you used from the reagent bottles, any relevant temperatures, and atmospheric pressure.
- Upload an appropriate data table that records your kinetic data and calculated rates.
- Record observations regarding the appearance and other general observations about the reaction mixtures (i.e. gas formation, precipitate formed, etc.).
- Compare the rate of O2 production for each of the kinetic runs by ranking them in order of decreasing speed of reaction (fastest to slowest). According to your data, which run led to the fastest and slowest rates?
- For the homogeneous catalyst of I–:
- What is the ratio of rates (rate of 1 M run/rate of 0.5 M run) for the different concentrations of homogeneous catalyst I–?
- Explain the difference (or lack of difference) in rates for the different concentrations of homogeneous catalyst I–. (hint: refer back to your answer to question #5 from Case Study)
- For the heterogeneous catalyst of MnO2:
- What is the ratio of rates (rate of 0.5 g run/rate of 0.25 g run) for the different concentrations of heterogeneous catalyst MnO2?
- Explain the difference (or lack of difference) in rates for the different concentrations of heterogeneous catalyst MnO2.
- For the experiment that you designed, discuss each of the following:
- What reaction conditions did you choose? Explain your decision making process.
- What effect does changing these variables have on the rate of production of O2 when compared to the slowest reaction conditions? How do you know you have the best set of parameters for the decomposition of H2O2?
- Do your results make sense? Why or why not?
- Based on the balanced chemical reaction, for the fastest kinetic runs, calculate the rate of disappearance of H2O2.
- Write a brief conclusion paragraph: comment on whether or not you achieved the goal of the experiment, being sure to address the questions posed in the “purpose” portion of the the safety, purpose and preparation questions. Support your conclusion using your data.
