
IV. Laboratory Activity
Preparation
- Read and understand Unit 5 Module 2 & 3
- Read all of lab Topic 8
- Complete pre-lab questions before coming to lab
Do this before you come to lab (have at the top of your notebook page to begin the lab):
- Safety: Answer the following questions:
- In lab this you will be given a dilute solution of imidazole in water. However, in the future you may encounter imidazole as a pure solid powder. Are there any different precautions one should take if imidazole is a dispersible powder vs dissolved make a water-based solution?
- Optical spectroscopy uses electromagnetic radiation to probe how samples interact with light; in this lab you will look at the visible region of the electromagnetic spectrum–is this region considered ionizing?
- Purpose: Write a few sentences about the purpose of this lab: What is the “big picture” viewpoint of the lab experiment? What question am I trying to answer? What data will be collected to answer the questions? What technique will I use to obtain these data?
- Preparation: Four drops of a 0.25 M imidazole solution were added to a solution in a cuvette containing ferrihemoglobin. The mass of the ferrihemoglobin solution in the cuvette was measured to be 2.655 g initially and 2.739 g after the addition of the stock imidazole solution. What is the molar concentration of imidazole in the final solution? Assume all densities are the same.
A. Introduction
The chemistry of protein-bound iron•heme complex is of keen interest since several heme proteins and enzymes (including catalase, peroxidase, cytochrome a3 and cytochrome c) are involved in metabolic functions within the human body. The biological function of hemoglobin, like of many proteins and most enzymes, is maintained by highly optimized reaction dynamics and delicately balanced chemical equilibria.
When iron is present in the +2 state, the ferrohemoglobin is capable of binding O2, and carrying out its biological function. This reaction can be written as
hemoglobin•4Fe(II)(aq) + 4O2(aq) hemoglobin•4[Fe(II) – O2](aq)
where hemoglobin•4Fe(II) represents ferrohemoglobin and the iron of the heme and hemoglobin•4[Fe(II) – O2] represents the hemoglobin-oxygen adduct. The “4” of the “4Fe(II)” is a result of the fact that hemoglobin protein is composed of four subunits. Each subunit contains an iron•heme complex that can reversibly bind oxygen. In the lungs, oxygen from the air is bound by hemoglobin in the blood and then transported through the arteries to myoglobin in muscle cells. In order to successfully achieve this transport, the oxygen binding constants of the hemoglobin to the oxygen must be the proper magnitude. The ability to measure equilibria is necessary if a detailed understanding of the biological function of proteins, such as hemoglobin, is to be obtained.
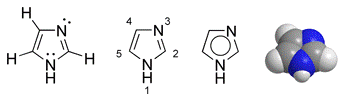
Hemoglobin is one of several proteins and enzymes that relies on the chemical versatility and tenability of the iron ion. In these systems, the structural environment that defines the ligand field of the ion influences the chemical properties of the ion. These properties include the ease with which the iron is oxidized and reduced, the rate with which ligands (molecules) are exchanged, and the effective size of the iron ion. In this laboratory exercise, you will study the binding properties of the model hemoglobin-ligand system, ferrihemoglobin-imidazole. Fig. 10.3 shows the structure of imidazole, abbreviated Im. Through your laboratory study, you will determine the binding constant for the overall reaction.
Analogous to myoglobin, ferrohemoglobin (Hb with 4 Fe2+) can easily be oxidized to ferrihemoglobin (Hb+ with 4 Fe3+) using suitable oxidizing agents. When the iron is present in the +3 oxidation state, the binding properties of the iron ion are modified; ferrihemoglobin binds to imidazole and ions, such as OH– and F–, rather than O2.
B. Your Laboratory Challenge
To prepare samples for study by optical spectroscopy, first all solids must be removed from the samples. High-speed centrifugation is an efficient way to remove suspended solids. Fill two 2-mL microcentrifuge tubes with equal amounts (~1.5mL each) of hemoglobin solution. It is very important that both centrifuge tubes contain equal volumes of solution. Place the samples across from each other in the rotor so that the rotor will be balanced as it spins (record the positions numbers occupied by your samples in your notebook.) Centrifuge for 5 minutes at the top speed of the centrifuge.
While you are waiting for the samples to finish spinning, you can set up and calibrate the spectrometer. Begin by launching the Logger Pro parameter file. You can navigate to the proper folder starting from Desktop → 412 → Hemoglobin. Once you have opened the Hemoglobin folder, you will find one Logger Pro File (heme.cmbl) and one Excel file (hemedata.xls); open both of these files.
- Within the Logger Pro software, go to the Experiment menu, select Set Up Sensors, and then select spectrometer. This should bring up a Spectrometer: 1 parameter window (see fig. at right). The window should contain parameters within the following range. WaveSmoothing: 0, Samples to Average 20, and Wavelength Range 400 -900 nm. The sample time might change depending on the calibration.

- In the upper right hand corner of this window, select the spectrometer icon,
 , and then select Absorbance from the resulting drop down menu. Next select Calibrate from the menu. While the lamp is warming up, prepare a blank cuvette by filling a cuvette with 3 mL of imidazole solution. Since this is a clear, colorless solution, it will function as a blank. Place the blank into the spectrometer and then click on the Finish Calibration button. At this point, the spectrometer records a dark spectrum (light off) and a bright spectrum (light on) to provide reference spectra on which the other measurements will automatically be compared. Click OK to continue when prompted to do so.
 - Click on the collect button. A graph should be displayed with data at a value of zero absorbance. In other words, for a clear, colorless solution, no light is being absorbed. Close the Spectrometer: 1 parameter window.
It is important that you label a cuvette with a marker so that the cuvette is consistently placed into the spectrometer in the same direction. Label the very top of one of the four sides of a cuvette with your initial. Put your mark high enough so that it will not affect the measurement. Place a small stir bar into the empty cuvette. Measure and record the mass of the assembly by first zeroing the balance and then massing the cuvette (with stir bar).
Decant the Hb•Fe+ solution from both centrifuge tubes into the cuvette; you should not disturb the solid or allow any of it to be transferred to the cuvette. You will leave a small amount of solution in each of the microcentrifuge tubes along with any solids that are present. Measure and record the mass of the Hb•Fe+-filled cuvette (with stir bar).
Remove the blank cuvette from the spectrometer and replace it with the hemoglobin sample. At this point, you should observe the spectrum of the sample in the graphics window of the Logger Pro software. Click on the stop button to stop the data acquisition and save the data. Repeat until the prescribed amount of drops of the imidazole solution have been added.
Data and Observations:
You may enter the following values into the Excel spreadsheet which also contains the columns shown in Tables 10.1 and 10.2. The Excel spreadsheet automatically calculates several columns for you; therefore, you are responsible for filling in the blank cells. Print a copy of your completed Excel file to include with your report.
Mass of Cuvette and stir bar __________________________
Wavelength Used for Absorbance measurements _________________
Concentration of Hb•Fe+ stock solution _______________________
Concentration of Imidazole stock solution _____________________
Table 10.1 Drops, masses,, and dilution factors
| Drops of Imidazole in Solution | Mass of sample cuvette + solution (g) | Mass of Solution (g) | Mass of Imidazole Added (g) | Dilution Factor of Imidazole | Dilution Factor of Hemoglobin |
| 0 | 0 | 0 | 1 | ||
| 1 | |||||
| 2 | |||||
| 3 | |||||
| 4 | |||||
| 5 | |||||
| 6 | |||||
| 10 | |||||
| 15 |
Table 10.2 Concentration and Absorbance Values
| Drops of Imidazole in Solution | Concentration of Imidazole (M) | Asorbance at ______ nm |
Dilution Corrected absorbance |
ΔAbsorbance
(Adrop#– A0) |
| 0 | 0 | |||
| 1 | ||||
| 2 | ||||
| 3 | ||||
| 4 | ||||
| 5 | ||||
| 6 | ||||
| 10 | ||||
| 15 |
Calculations:
The following section describes the calculations needed to complete the experiment. Please realize that the Excel spreadsheet is set up to automatically calculate several columns for you. Therefore, you are responsible for filling in the blank cells in the hemedata.xls file and understanding how Excel is calculating the automated columns.
There are several dilution factors that must be calculated. First, as a drop of imidazole solution is added to the hemoglobin solution, it is diluted by a factor of the ratio of the mass of the imidazole added to the total solution mass. Masses can be used to determine the dilution factor since the densities of all solutions are assumed to be equal. Second, as the drop is added to the solution volume, the hemoglobin is also diluted by an analogous factor of the ratio of the initial hemoglobin solution mass (i.e. before any drops were added) to the total solution mass. The concentration of imidazole in the sample can then be obtained by multiplying the stock solution concentration by the dilution factor.
Next, you will need to record the Absorbance of the solution after each drop of imidazole is added (do not include the blank’s absorbance in the Excel table, the blank is the imidazole only solution). Select a wavelength in a region of the spectrum in which a large change in the absorbance was observed. Record the wavelength selected. If the cursor is not shown in the graphics window, click on the examine button,![]() , to turn on the cursor. Place the cursor at the wavelength of interest; the absorbance values of each run will be displayed in the text box. Enter these values into the data table.
, to turn on the cursor. Place the cursor at the wavelength of interest; the absorbance values of each run will be displayed in the text box. Enter these values into the data table.
The analysis assumes that the concentration of hemoglobin remained the same throughout the experiment; however, this was not the case. To compensate for the dilution of the hemoglobin, each absorbance value must be divided by the dilution factor of the hemoglobin. Once the absorbance has been corrected for dilution, determine the change of absorbance (ΔA=A-A0) caused by each drop of imidazole solution and enter it into the data table. At this point, use Excel to create a plot of the change of absorbance as a function of the imidazole concentration. You should observe a shape that changes quickly at low concentrations and approaches an asymptotic limit at high concentrations.
As shown in more detail in the Topic 10 appendices, the equilibrium constant can be calculated using the following expression:
![\displaystyle Keq=\frac{{{1}{(A}{-}{A}_{0})}}{{[Im]}{(A}_{100}{-}{A})}}](https://pressbooks.uiowa.edu/app/uploads/quicklatex/quicklatex.com-ad4bc84d6c40b5cb76d4cff1edbeb132_l3.png "Rendered by QuickLaTeX.com")
where A is the equilibrium absorbance of the experimental solution, A0 is the absorbance of the unbound hemoglobin (no imidazole), and A100 is the absorbance of the bound hemoglobin-imidazole adduct. If we define ΔA as A-Ao, the expression can be further arranged to obtain the linear form:
 *
* ![\displaystyle \frac{{1}}{[Im]}}](https://pressbooks.uiowa.edu/app/uploads/quicklatex/quicklatex.com-61b920935b9f9dc3d57883960cbdb8d8_l3.png "Rendered by QuickLaTeX.com") +
+  =
= 
which corresponds to mx + b = y with
m = , b = , x = , and y =
Thus, if a plot of the reciprocal of ΔA is plotted as a function of the reciprocal of the imidazole concentration, the equilibrium constant can be obtained from a best fit line parameters simply as,
Keq = 

Use Excel to create such a plot (XY scatter plot.) Be sure to label the axes and create a title. To obtain a best fit line, first click on the plot to activate it. Then go to the Format tab under Chart Tools and select Trendline. Under the Trendline button, select More Trendline Options. Check the boxes for Linear trendline type, Display equation and Display R-squared value. Click OK when finished. From the best fit equation parameters, determine the equilibrium constant of imidazole binding to hemoglobin.
C. Communicating Your Results
For a permanent record, both your data and report should be written in your notebook.
- Safety
- Purpose
- Preparation
- To summarize the data, observations, and calculations section, be sure that you include all of the following in your lab report:
- An image of your Excel spreadsheet.
- A sample calculation of the imidazole dilution factor and the imidazole concentration in the sample solution.
- A plot of the change of absorbance as a function of the imidazole concentration.
- A plot of the reciprocal of ΔA as a function of the reciprocal of the imidazole concentration.
- The calculation of the equilibrium constant (Keq)
- Using your value of Keq and the [Im]eq after 3 drops of imidazole solution is added, what is the ratio of [Hb•Fe-Im+] to [Hb•Fe+]? Which form of the protein is favored under these conditions?
- Provide an explanation for why it is correct to assume that the [Im]eq is nearly equal to the [Im]initial. To aid your explanation:
- Find the initial, or the most dilute, imidazole concentration.
- Find the maximum concentration of hemoglobin in the experiment (you will need to know that the hemoglobin solution is prepared as 1.0 g/ 500 mL and that the molecular mass of hemoglobin is 68000 g/mol).
- Compare the most dilute imidazole concentration to the maximum concentration of hemoglobin.
- Explain how you selected the wavelength to be used to monitor the absorbances in your experiment. Is there another wavelength that would also be suitable? What wavelength would not be suitable? Why?
- After 10 drops of imidazole solution, use your value of Keq to calculate what percentage (or fraction) of the protein was actually bound to imidazole. Note: The beginning of Topic 8 Appendix B may provide help with starting this problem.
- Write a brief conclusion paragraph. Comment on whether or not you achieved the purpose of the experiment and support your conclusion using your results.
References
- S. O. Russo, G. I. H. Hanania, J. Chem. Educ., 1990, 67, 352.
- E. Antonini, M. Brunori, Hemoglobin and Myoglobin in their Reactions with Ligands, North-Holland Publishing Company: Amsterdam, 1971.
