
Blood Glucose Goals
Glycemic targets aimed at the prevention of long-term microvascular and macrovascular complications have been defined by multiple organizations (Table 2).
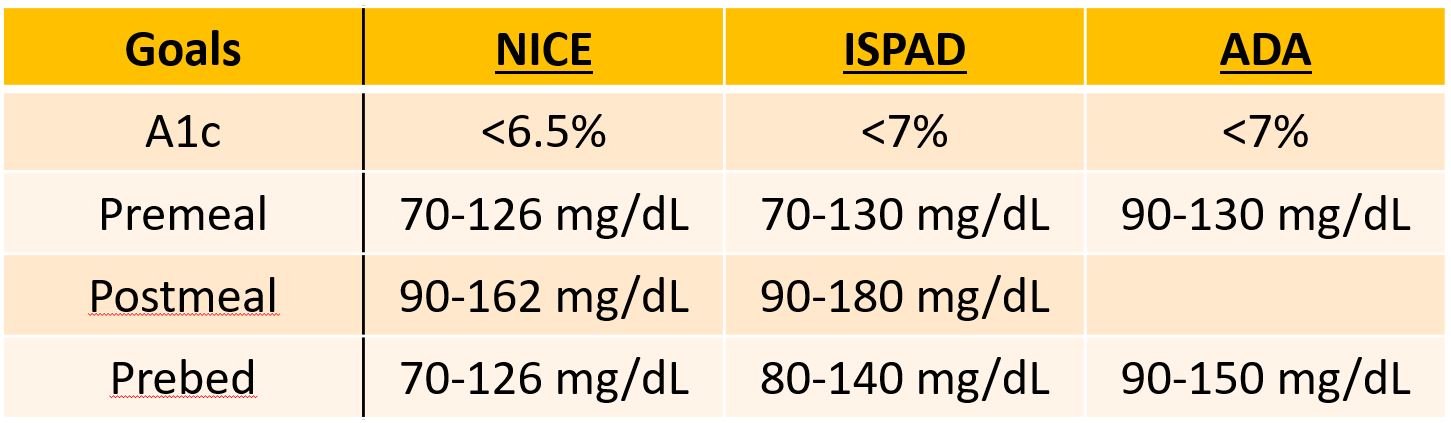
Here at Stead Family Children’s Hospital, we use a combination of the ISPAD and ADA glycemic goals. Goals are individualized to the patient’s condition and age.
Glycemic Goals at Stead Family Children’s Hospital:
Age 6 and Older:
- Before meals: 70 – 150 mg/dL
- Bedtime and during the night: 90 – 150 mg/dL
Age 1 to 5:
- Before meals: 80 – 150 mg/dL
- Bedtime and during the night: 90 – 150mg/dL
We adjust insulin regimens with the goal of keeping the majority of blood glucose values in these goal ranges, but we know that keeping 100% of blood sugars in this range is not (yet) always achievable. Highs and lows happen, even for diabetics with tight glycemic control.
The increased use of continuous glucose monitors (CGMs) in the outpatient setting has recently led to a consensus that the aim is to keep greater than 70% of blood sugars within a target range of 70mg/dL to 180mg/dL.
Hemoglobin A1c (HbA1c) is the most commonly used blood test used to track compliance with insulin therapy and glycemic control over time.
- Goal HbA1c in children < 18 years of age is <7%
- Less stringent goals (<7.5-8%) may be appropriate in children who cannot articulate symptoms of hypoglycemia, have hypoglycemia unawareness, have limited life expectancy, or where the harms of treatment are greater than the benefits.
HbA1c is formed due to non-enzymatic glycosylation of Hemoglobin A and higher proportions of glycated hemoglobin occur with higher concentrations of blood glucose.
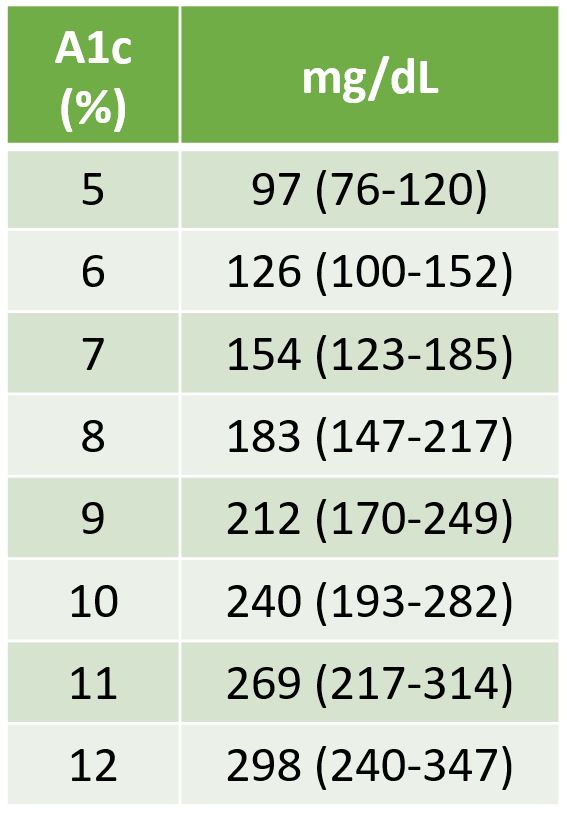
Since the majority of hemoglobin is contained within red blood cells and red blood cells have an average lifespan of 120 days, HbA1c is a representation of average blood glucose concentration over the preceding 2-3 months.
Table 3 demonstrates the approximate conversion of A1c to average blood glucose.
There are many conditions that may lead to falsely elevated or lowered HbA1c values due to changes in the typical erythrocyte lifespan (e.g. asplenia, splenomegaly, pregnancy, various causes of anemia), changes in glycosylation (e.g. Vitamin E ingestion, chronic alcohol consumption, blood transfusions), and assay interferences (e.g. Vitamin C ingestions). (Radin, 2013)
Alternative methods of glycemic control may be necessary such as fructosamine (which reflects blood glucose control over the preceding 2-3 weeks).
Quiz Yourself:
References and Recommended Readings:
-
de Bock M, Codner E, Craig ME, Huynh T, Maahs DM, Mahmud FH, Marcovecchio L, DiMeglio LA. ISPAD Clinical Practice Consensus Guidelines 2022: Glycemic targets and glucose monitoring for children, adolescents, and young people with diabetes. Pediatr Diabetes. 2022 Dec;23(8):1270-1276. doi: 10.1111/pedi.13455. PMID: 36537523; PMCID: PMC10107615.
- ElSayed NA, Aleppo G, Aroda VR, et al., American Diabetes Association. 6. Glycemic targets: Standards of Care in Diabetes—2023. Diabetes Care 2023;46(Suppl. 1):S97–S110
- Nathan, D. M., Kuenen, J., Borg, R., Zheng, H., Schoenfeld, D., & Heine, R. J. (2008). Translating the A1C assay into estimated average glucose values. Diabetes Care, 31(8), 1473-1478. doi:10.2337/dc08-0545

Feedback/Errata