
24 Global Climate Change
Climate Change
According to a recent headline from the National Oceanic and Atmospheric Administration (NOAA),
“July 2019 was hottest month on record for the planet”
Click here to read the full report.
NOAA. (2019). July 2019 was the hottest month on record for the planet. Retrieved from https://www.noaa.gov/news/july-2019-was-hottest-month-on-record-for-planet
Fast Facts:
- Since record keeping began in 1880, July 2019 was the hottest month on record.
- Year-to-date, January to July 2019 was the second-hottest time period on record with temperatures 1.71 degrees F higher than average globally.
- Arctic and Antarctic sea ice levels were both at record lows for the month of July.
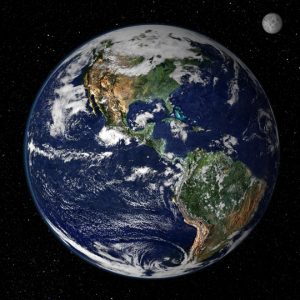
At the most basic level, climate change is a significant change over a 30-year period from the typical or expected weather patterns of an area. Earth’s climate has always fluctuated; the difference now is that Earth is experiencing significant climate change in a much shorter time period–decades rather than millions of years.
Climate change is human-caused. Since the rise of industrialization in the 19th century, humans have relied more and more on fossil fuels for energy. However, fossil fuels release a significant amount of greenhouse gases, especially carbon dioxide, into the air when they are burned. This has led to a rapid rise in global temperature as well as many other changes to Earth’s natural balance.
The video, below, shows Earth’s temperature increase between 1880 and 2017.
Video Credit: “Global Temperature” by NASA Climate Change is public domain
Tipping Points: The Point of No Return
Human caused climate change is not a new idea.
- In 1861, scientist John Tyndall explained how greenhouse gases like carbon dioxide and water vapor absorb heat in the atmosphere.
- In 1896, scientist Svante Arrhenius built upon Tyndall’s work and predicted global warming.
- In 1956, an article published in the New York Times discussed the role of carbon dioxide in human-caused climate change (Click here to access the article).
- In 2006, Al Gore’s popular documentary An Inconvenient Truth warned the general public of imminent and serious consequences of climate change.
Despite decades of warnings and scientific data, human-caused climate change has severely escalated. Atmospheric carbon dioxide has massively increased leading to higher global temperatures and a multitude of other serious consequences for the planet.
Recently, scientists have warned that we are near to reaching a tipping point, a place of irreversible damage where abnormal and extreme climate change conditions become the norm. Some climate models predict that Earth could reach a tipping point by 2060 if significant action is not taken to reduce greenhouse gas emissions and other human factors that accelerate climate change.
Global Impact of Climate Change
Due to climate change, Earth’s systems are out of balance. Global systems have more energy than normal and climate change events are often amplified by each other. This creates a positive feedback loop which has wide-ranging effects. including more extreme temperatures, more extreme weather events, melting sea ice, glacier retreat, sea level rise, and ecosystem disruption.
Watch the video, below, for a quick overview of the impacts of climate change.
Video Credit: “Earth Has a Fever” by NASA Global Climate Change is public domain
More Extreme Temperatures
Climate change is not just global warming. Although Earth’s climate is heating up overall, climate change leads to increased frequency and intensity of temperature–a weather event–at both the high and low range of the spectrum.
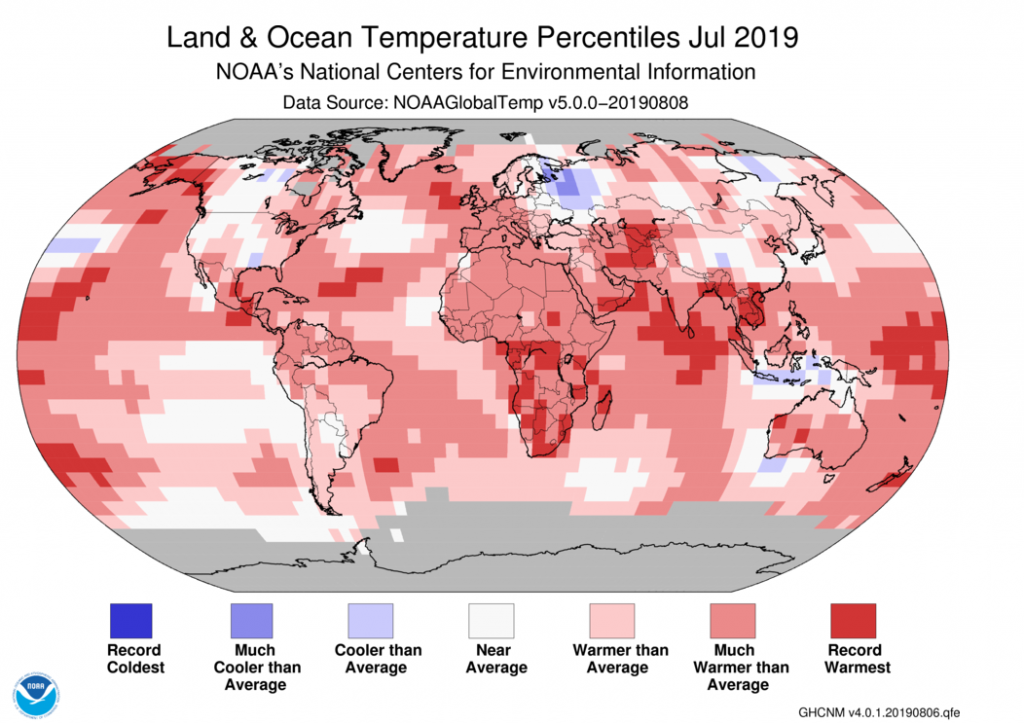
For example, July 2019 was the hottest month on record globally. On the map, below, the pink and red shading indicates areas that had warmer than average temperatures (essentially the entire planet).
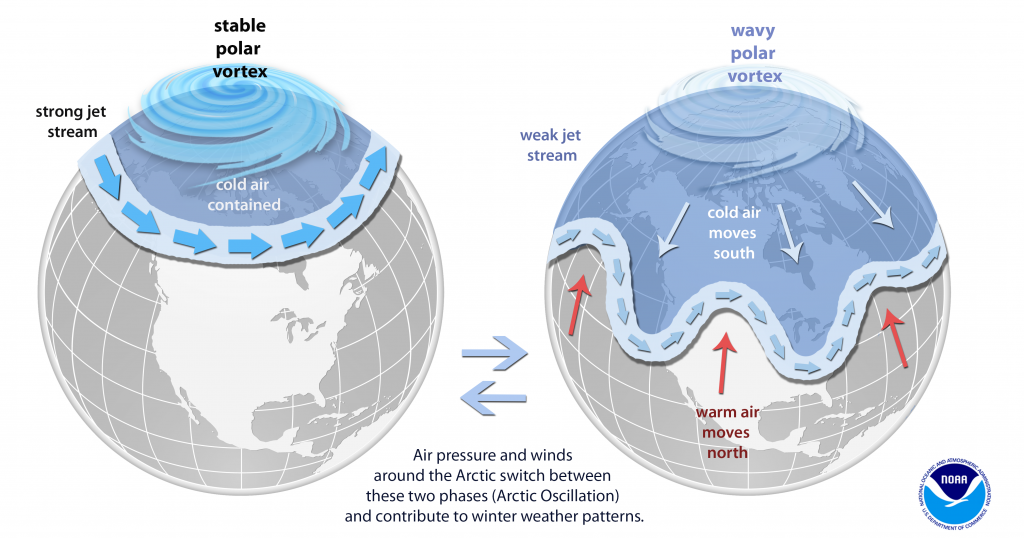
On the other hand, climate change can also cause extreme and abnormally cold temperatures. As seen in the images below, the polar vortex–a system of freezing wind and air–split from its normal position over the Arctic in January 2019. The vortex, now unstable, caused the jet stream to warp from its normal pattern. This pushed extremely cold Arctic air down to the midwestern United States while areas of Alaska experienced warm weather. While the polar vortex is an example of weather, not climate, it is likely that the planet will experience more frequent and unexpected temperature extremes such as this due to the effects of climate change.
More Extreme Weather Events
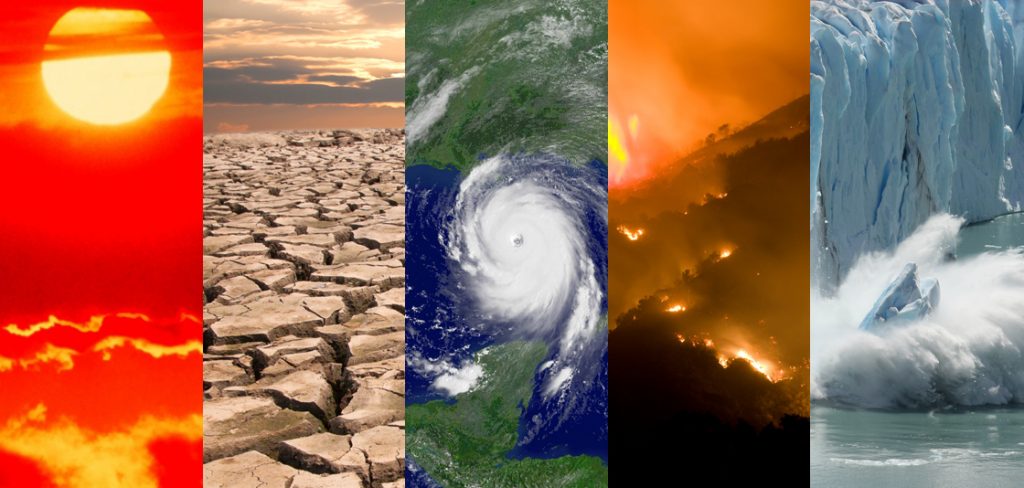
An increase in the frequency and intensity of extreme weather events is one way many people can observe and recognize climate change. The image, below, shows weather events that typically increase due to climate change. From left to right they are: heat waves, drought, hurricanes, wildfires, and melting sea ice.
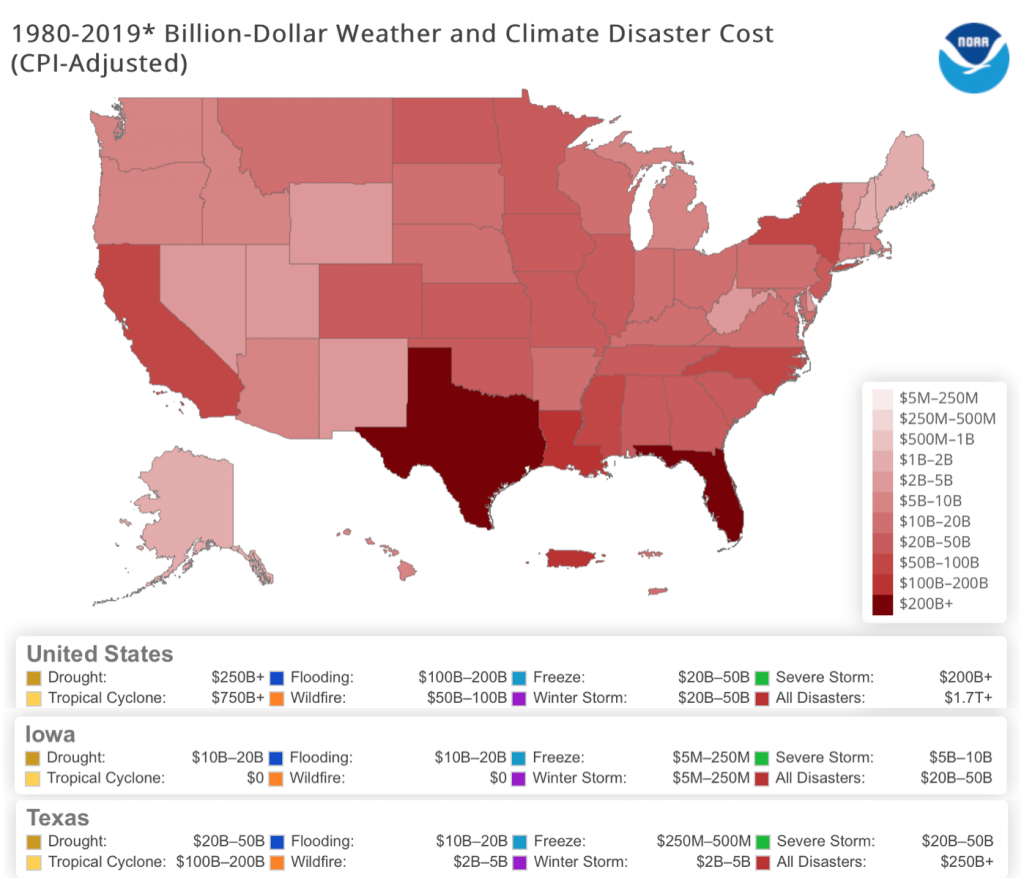
The map, below, shows the cost per state in weather disasters causing $1 billion or more in damages between 1980 and 2019. In total, these disasters costed the U.S. more than $1.7 trillion, although different states were affected by different types of weather.
- Iowa (shaded a medium red color on the map) has experienced the most impact from drought and flood-related damages, each costing between $10-20 billion.
- Texas (shaded a dark red color on the map) has suffered the most from tropical cyclones–including Hurricanes Rita, Ike, and Harvey–with a total cost of $100-200 billion.
Click here to access the interactive map and see data for other states.
K-6 Standards
MS-ESS3-2. Analyze and interpret data on natural hazards to forecast future catastrophic
events and inform the development of technologies to mitigate their effects.
Melting Sea Ice
Melting sea ice affects the entire planet, not just the Arctic. Arctic sea ice acts as Earth’s air conditioner. Air masses and ocean currents carry the ice’s cooling effect to other parts of the planet. As shown in the animation, below, Arctic sea ice has been steadily shrinking for decades.
Video credit: “Arctic sea ice growing younger, thinner” by NOAAClimate is public domain
Temperatures at the North and South Poles are rising at twice the rate of the rest of the world due to melting ice and the albedo effect. This is an example of a positive feedback loop: As temperatures warm, more sea ice melts into water which absorbs solar radiation and causes temperatures to warm even further. The image, below, illustrates this positive feedback loop.
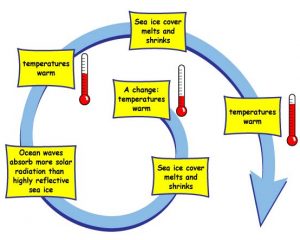
As the darker-colored seawater absorbs the Sun’s radiation, the oceans heat up. Higher ocean temperatures negatively affect plants and living creatures in aquatic ecosystems which affects marine-based economic industries, such as fishing, in turn.
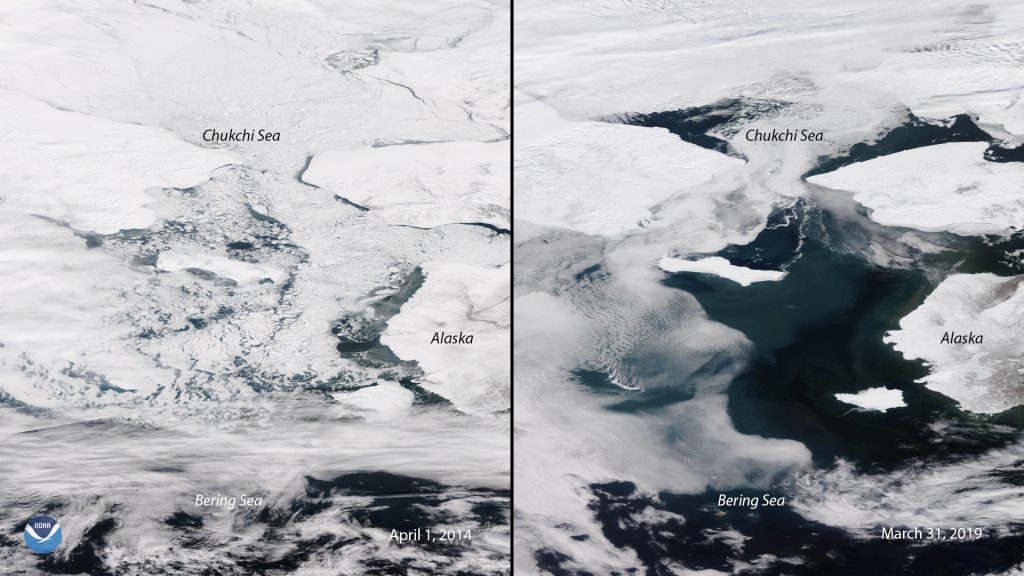
The photos, below, show the Bering and Chukchi Seas which are located in the northern Pacific Ocean between Alaska and Russia. These seas typically have maximum ice cover in late March and early April; as seen in the image on the left, most of the sea is covered in ice. Just five years later, the image on the right shows significantly less ice on the sea. In fact, 2019 had the lowest levels of ice on record for this region.
Glacier Retreat
Glaciers are large bodies of snow and ice that move slowly across land. Glaciers naturally fluctuate in size with the seasons, but climate change has led to warmer temperatures overall. This means that glaciers melt at a faster rate than snow falls to rebuild the glacier’s mass, a phenomenon called glacier retreat.
Melting glaciers affects the ecosystem of an area because different plants and animals will not be able to survive in a changing landscape. Additionally, humans rely on typical ice melt from glaciers as a critical water source which dwindles when glaciers retreat.
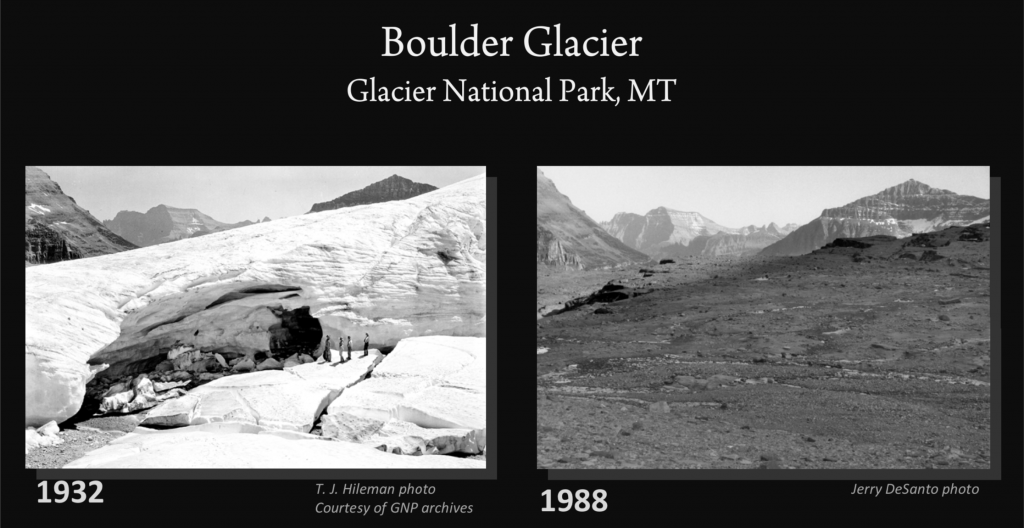
For example, when Montana’s Glacier National Park was created in 1910, it had 150 glaciers. Today, only 26 remain and they are all significantly smaller than their original size. The image, below, shows the significant retreat of the Boulder Glacier. Today, the glacier is so small it is considered inactive. Click here to see more images of glacier retreat.
Sea Level Rise
The main cause of sea level rise is thermal expansion. When water is heated, its volume increases. Picture a pot of water boiling on the stove: When the liquid water heats, it expands and turns to steam which has a larger volume.
The same thing happens with water in the ocean. As Earth’s temperature increases due to climate change, the oceans are absorbing 90% of the increased heat. As the temperature of the ocean increases, its volume increases so sea level rises.
Watch the following video for more explanation of thermal expansion.
Video Credit: “The Secret to Rising Sea Levels–Thermal Expansion” by ASAP Science, video used with permission
The second cause of sea level rise is ice melt from land. As global temperatures rise, ice sheets and glaciers are melting at increasingly fast rates. However, it is important to note that only ice melt from Antarctica and other land masses contributes to sea level rise.
- Antarctica is a continent so it has land underneath the ice. When the ice melts, it runs off into the ocean. Thus, there is more water in the ocean and sea level rises.
- Ice at the North Pole floats in the ocean; it does not have land underneath. Therefore, the volume of water in the ocean stays the same and sea level does not change when Arctic ice melts.
Like Antarctica, ice melting off of Greenland contributes to sea level rise because Greenland is an island (there is land underneath the ice). Watch the following short video for further explanation.
Video Credit: “Greenland Ice” by NASA Global Climate Change is public domain
Ecosystem Disruption
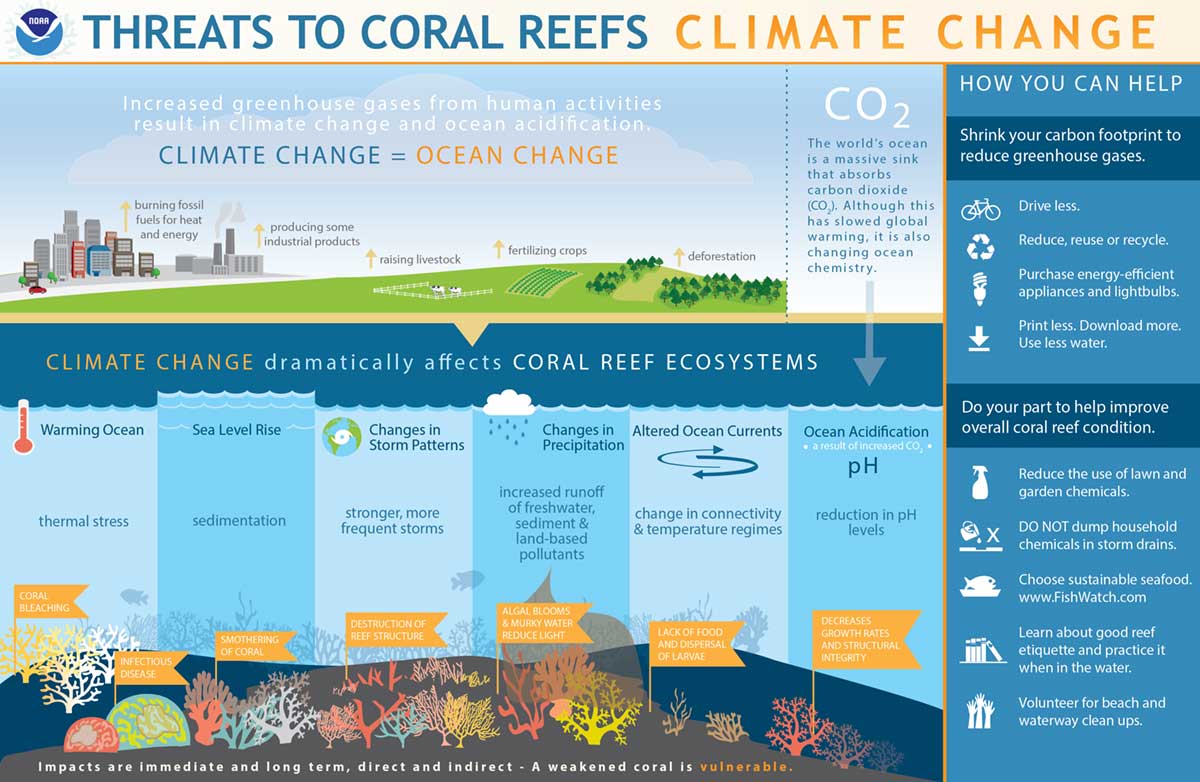
As the climate changes, the delicate balance of many ecosystems is disrupted or even destroyed. One example is coral reefs. Coral reefs play a critical role in the ocean ecosystem–they provide shelter for thousands of marine species, they regulate carbon dioxide levels in the ocean, they protect the shoreline from rough waters and storms, and they generate billions of dollars in revenue from fishing and tourism.
Coral reefs are severely impacted by climate change. Scientists estimate that more than a quarter of coral reefs have died worldwide in the last three decades. Read the infographic below to learn more about coral reefs and climate change.
K-6 Standards
K-ESS2-2. Construct an argument supported by evidence for how plants and animals (including
humans) can change the environment to meet their needs.
What is Being Done?
A Short Timeline of Events
- December 2015-Paris Climate Accord: 195 countries agree to reduce greenhouse gas emissions in order to keep the global temperature increase below 1.5-2°C.
- June 2017-President Trump announced that the U.S. would be pulling out of the Paris Climate Accord.
- October 2018-A special report from the Intergovernmental Panel on Climate Change (IPCC) states that Earth could reach the 1.5°C tipping point by 2040. The world is not on track to meet this goal without huge and immediate changes.
- July 2019-The hottest month on record globally according to a report by NOAA,.
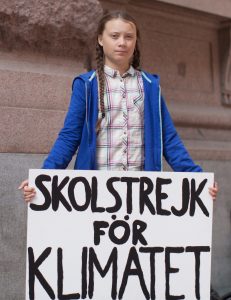
- September 2019-Global Climate Strike: Led by young people and 16-year-old activist Greta Thunberg, millions of people gather around the world to demand action on climate change.
- October 4, 2019-Greta Thunberg visits Iowa City (!) in support of local student-led climate strikers. More than 3,000 people attended the climate strike in downtown Iowa City.
Climate change is in the news nearly every day. One way to keep up with current events is to subscribe to Climate Fwd, a weekly newsletter from the New York Times. You can find information in the Helpful Links chapter of this book.
Misinformation and Doubt
Key Takeaway
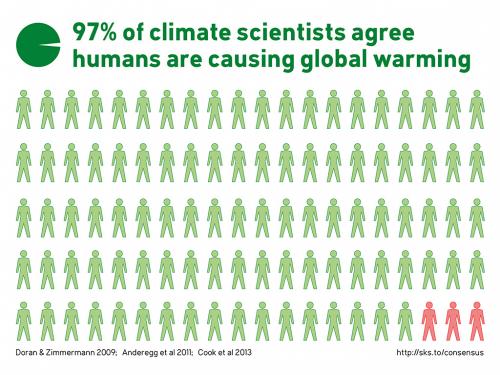
As shown in the graphic, below, 97% of scientists agree that climate change is human-caused. This data comes from a study of 11,944 peer-reviewed scientific articles by Cook, et al. (2013).
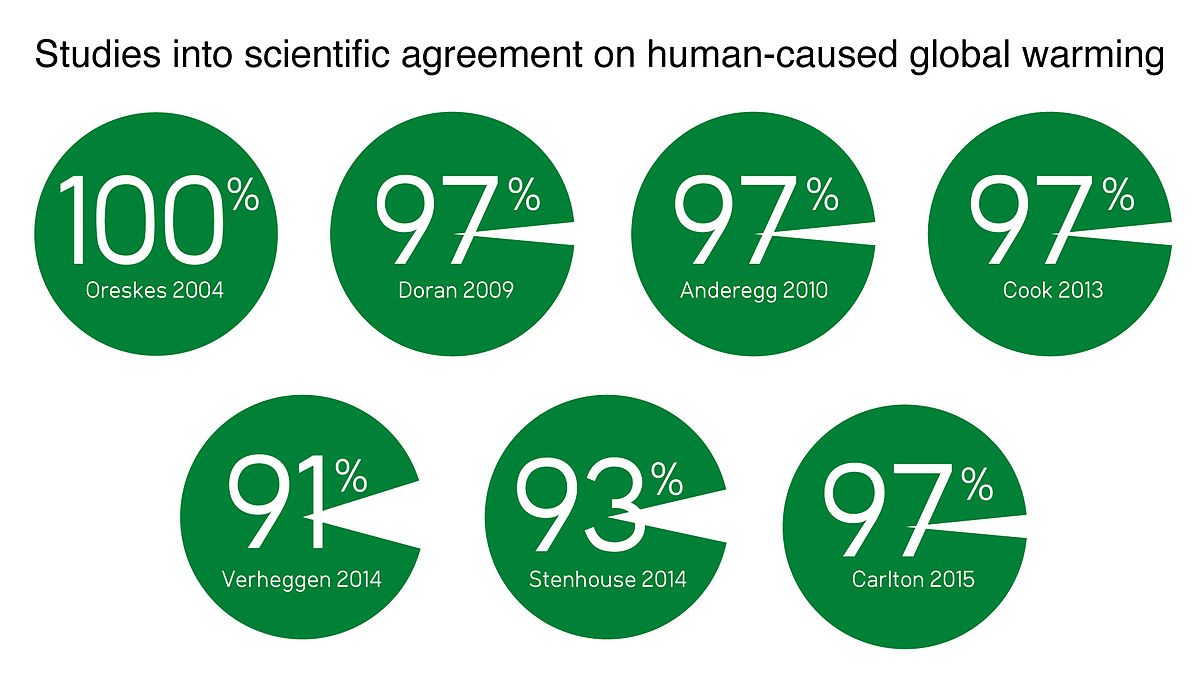
As shown in the graphic, below, this conclusion has been corroborated by a number of other studies. Among scientists, there is near-consensus that climate change is human-caused.
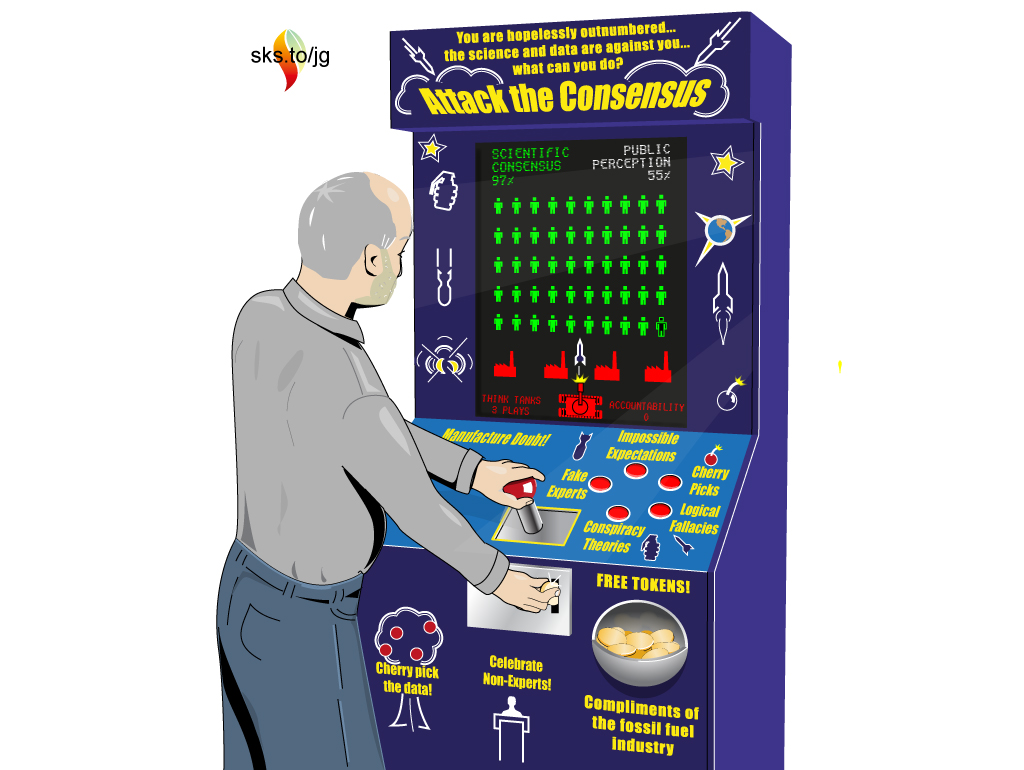
Despite the scientific data, there is still widespread misinformation and doubt spread to the public. Large corporations and wealthy individuals have significant economic and political through which they influence climate change policies and information. These climate deniers are economically driven; by donating to causes that deny climate change, climate deniers make more money. As such, conservative billionaires and mega corporations spend billions of dollars funding climate denial initiatives each year. As a result, misinformation and incomplete information about climate change is disseminated to the public causing confusion and doubt.
Click here to “Meet the Money Behind the Climate Denial Movement”.
Prominent climate deniers include:
- ExxonMobil: One of the largest oil companies in the world.
- Koch family foundations: Related to Koch Industries, a multi-billion dollar conglomerate of companies in the oil, gas, paper, and chemical industries.
- The Bradley Foundation, Searle Freedom Trust, Coors affiliated foundations, Scaife affiliated foundations, and the DeVos Foundation: Wealthy conservative family foundations that have contributed to climate change denial.
- Donors Trust and Donors Capital Fund: Two related organizations that pool the funds of large donors to give to conservative causes. Known donors include, again, the Bradley Foundation, Searle Freedom Trust, Coors affiliated foundations, the DeVos family, and the Koch family.
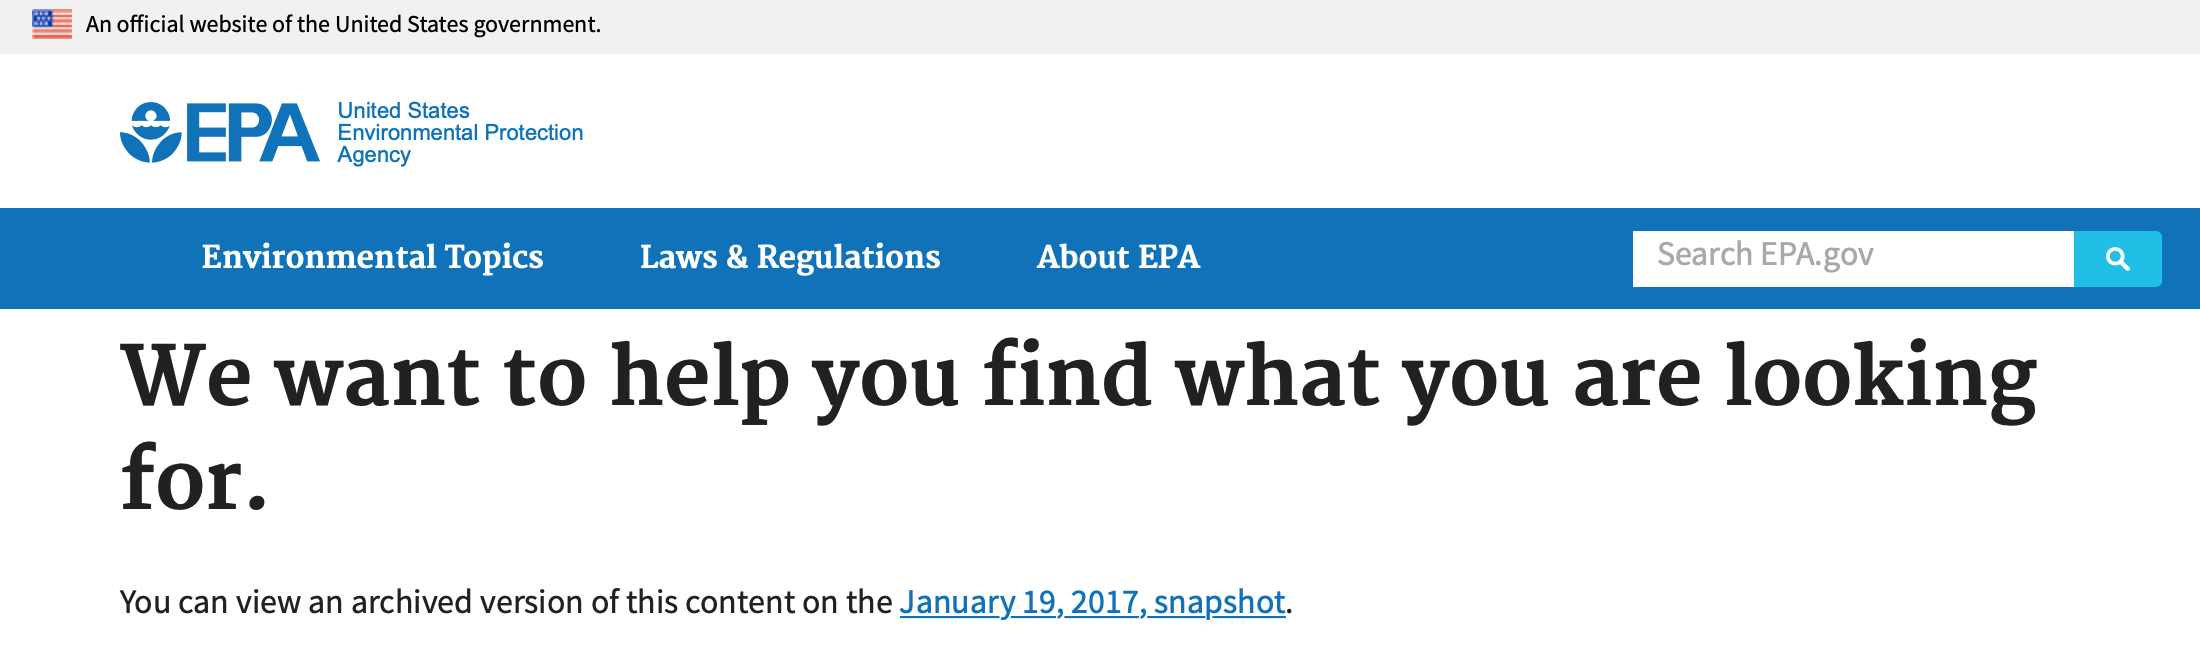
Climate change information on the Environmental Protection Agency’s (EPA) website has been significantly altered during the Trump administration.
- Starting in 2017, several pages about climate change were removed or “being updated” for a year and a half. If you visit the EPA’s website, climate change is not one of the suggested environmental topics nor does it appear anywhere on the homepage.
- In October 2018, the EPA stopped updating many of its climate pages. The image, below, shows what happens if you navigate to epa.gov/climatechange, the former climate change homepage.
In a 2019 report, the Environmental Data and Governance Initiative analyzed 5,300 government webpages. They found that “over half of all pages where ‘climate change’ was completely removed from public access (73/136) were U.S. Environmental Protection Agency (EPA) pages” (Nost et al., 2019). All of these changes limit and confound the public’s access to credible scientific information.
We need to be clear on the science behind climate change. Although the majority of science teachers cover climate change in their curriculum, one survey found that 30% of teachers “tell students that the current warming ‘is likely due to natural causes'” (Mooney, 2016). As teachers, it is up to us to help our students access accurate scientific information and prevent misconceptions.
To find more credible sources of information about all things science, check out the Helpful Links chapter of this book.
Sources:
Mooney, C. (2016). How teachers are getting it wrong on climate change. The Washington Post. Retrieved from https://www.washingtonpost.com/news/energy-environment/wp/2016/02/11/how-teachers-are-getting-it-wrong-on-climate-change/
Nost, E., Gehrke, G., Lemelin, A., Beck, M., Braun, S., Malival, G., and EDGI. (2019). New report analyzes changes to climate topics across thousands of US federal agency websites. Retrieved from https://envirodatagov.org/new-report-analyzes-changes-to-climate-topics-across-thousands-of-us-federal-agency-websites/
NGSS
| 5-ESS3-1. | Obtain and combine information about ways individual communities use science ideas to protect the Earth’s resources and environment. |
|---|
| MS-ESS3-5. | Ask questions to clarify evidence of the factors that have caused the rise in global temperatures over the past century. [Clarification Statement: Examples of factors include human activities (such as fossil fuel combustion, cement production, and agricultural activity) and natural processes (such as changes in incoming solar radiation or volcanic activity). Examples of evidence can include tables, graphs, and maps of global and regional temperatures, atmospheric levels of gases such as carbon dioxide and methane, and the rates of human activities. Emphasis is on the major role that human activities play in causing the rise in global temperatures.] |
|---|
| MS-ESS3-4. | Construct an argument supported by evidence for how increases in human population and per-capita consumption of natural resources impact Earth’s systems. [Clarification Statement: Examples of evidence include grade-appropriate databases on human populations and the rates of consumption of food and natural resources (such as freshwater, mineral, and energy). Examples of impacts can include changes to the appearance, composition, and structure of Earth’s systems as well as the rates at which they change. The consequences of increases in human populations and consumption of natural resources are described by science, but science does not make the decisions for the actions society takes.] |
|---|
DCI
Fifth GRade
ESS3.C: Human Impacts on Earth Systems
middle school
ESS3.D: Global Climate Change
ESS3.C: Human Impacts on Earth Systems
Finite sources of energy derived from ancient remains of decomposing organisms. The main fossil fuels are coal, oil, and natural gas.
An asymmetrical gas in Earth's atmosphere that traps heat. The main greenhouse gases are carbon dioxide, nitrous oxide, methane, and water vapor.
A process where one change triggers the next in a continuous cycle that encourages the initial change.
A significant change over a 30-year period from the typical or expected weather patterns of an area. Modern climate change is human-caused.
The short term atmospheric conditions in an area.
A large current of wind which carries warm and cold air masses to different areas of Earth.
The typical weather conditions in an area over a 30-year period.
A large body of air that takes on the climatic conditions of the area where it is formed.
The amount of energy reflected by a surface. Light surfaces tend to have a high albedo because they reflect more energy. Dark surfaces tend to have a low albedo because they absorb more energy.
When glaciers melt at a faster rate than snow falls to rebuild the glacier's mass.
An increase in the volume of matter when its temperature increases.
As global temperature increases, ocean water heats and expands which contributes to sea level rise.
Large body of snow and ice that moves slowly across land.
An interconnected community of all the living organisms and the physical landscape of an area.
A place of irreversible damage where abnormal and extreme climate change conditions become the norm.
