
2 Ecology
Ecology Big Ideas and Big Questions
Big Ideas
- Living organisms in ecosystems are dependent upon each other.
- Changes in the population of one type of living organism in an ecosystem will have an impact on the population of other living organisms in the ecosystem.
- There are patterns to the interactions between different organisms.
Big Questions
- What are the patterns within relationships and ecosystems?
- How do organism populations affect to each other?
- How are living things interrelated?
- How does energy flow through a food chains and webs?
Ecology Overview
Ecology is an overarching idea of Biology. As we explore the biological concepts we will explore ecology all throughout. Ecology demonstrates the science phenomena of relationships in environments. Relationships can tell us about a specific environment and the interactions between the abiotic (non-living) and biotic (living) factors. In this section we are going to break ecology down by looking at biomes and ecosystems through food chains, food webs, and ecological pyramids. We will also discover population growth patterns.
Teacher Time Out: Ecosystem and Biomes
How does this connect to the NGSS Progression
DCI: LS2.A Interdependent relationships in ecosystems: Students in the K-2 grade band focus on animal characteristics. As students progress there is a science conceptual shift towards animal consumption. This idea begins to introduce basic interactions in an ecosystem where grade band 6-8 advances to cause and effect relationships.The learning of biomes allows us as future teachers to understand specific relationships between animals.
|
K-2 |
3-5 |
6-8 |
|
| LS2.A Interdependent relationships in ecosystems | [Content found in LS1.A]LS1.A All organisms have external parts that they use to perform daily functions. | The food of almost any animal can be traced back to plants. Organisms are related in food webs in which some animals eat plants for food and other animals eat the animals that eat plants, while decomposers restore some materials back to the soil. | Organisms and populations are dependent on their environmental interactions both with other living things and with nonliving factors, any of which can limit their growth. Competitive, predatory, and mutually beneficial interactions vary across ecosystems but the patterns are shared. |
DCI: LS2.C Ecosystem dynamics, functioning, and resilience: Students are first introduced to this DCI in grade band 3-5 where they focus on singular environmental factors of one population at a time. This concept is expanded upon in grades 6-8 as they aim to look at environmental factors as a blended relationship. Currently learning about Ecosystems will allow us to have a deepened comprehension of relations.
|
K-2 |
3-5 |
6-8 |
|
| LS2.C Ecosystem dynamics, functioning, and resilience. | N/A | When the environment changes some organisms survive and reproduce, some move to new locations, some move into the transformed environment, and some die. | Ecosystem characteristics vary over time. Disruptions to any part of an ecosystem can lead to shifts in all of its populations. The completeness or integrity of an ecosystem’s biodiversity is often used as a measure of its health. |
Fromhttps://static.nsta.org/ngss/20130509/AppendixEDCIProgressionsWithinNGSS_1.pdf
Implementation into the Classroom
An initial engagement activity where students learn about the interconnectedness of an ecosystem.
Ecosystems
An ecosystem is an environment that includes both biotic and abiotic factors that interact in an area. There are commonly five types of interactions in an ecosystem. These interactions can affect an ecosystem’s population balance both positively and negatively. As we explore these types of interactions, think about what is being affected and the possible outcomes. Challenge yourself to identify other interactions that fit within these five types of interactions.
Key Interactions within an Ecosystem
Predator and Prey
A predator species is typically at or near the top of the food chain. Predators at the very top of a food chain are known as apex predators. In a predator / prey relationship the predator consumes the prey to gain needed energy to function. This interaction has a close relationship that creates a cause and effect pattern. If one population goes up the other population will quickly follow. If one population goes down the population of the other species may decline. A predator prey relationship could include a rabbit and a fox. The fox is the predator and the rabbit is the prey. If there is a large population of rabbits the fox population could see an increase because there is an abundant amount of food.
Competition
A competitor relationship has battles. These battles for competition can happen within the species or with other outside species. The strongest and most clever individual wins resulting in the population continuing to grow with the best genes. An example of this would be when a member of a species tries to locate a mate. Let’s discover a male lions during the mating season. The male lions will compete to see who is the strongest to capture the wanted mate. The strongest more dominant wins to mate and reproduce, likely passing on genes that may make the offspring strong. If the battle for competition takes place outside of the species it could result in a population species decrease or reproduction of the lower species with adaptations that continue to help the species thrive. In the worst case the species could become extinct due to the competition.
Parasitism
With Parasitism one species (the parasite) typically harms the another species. The parasite lives off of the other species which can be referred to as the host. The other species hosts the parasite. The host of the parasite does not benefit from the parasite species rather it has negative effects from the parasite species. The parasite is living on the host, taking enough of the host’s energy and nutrients to stay alive. If the parasite takes too much from the host the host could lose too much needed nutrients and energy. One example of this includes Roundworms and cats. The Roundworms would be the parasite and the cat would be the host. The Roundworms take the nutrients and steals energy away from the cat. The cat does not benefit from the Roundworms. The cat may have to increase their amount of food intake in order to survive. Another example would be mosquitoes and plasmodium. The plasmodium is the parasite which lives in the mosquito (host). Mosquitos then transport the parasite to other organisms, such as humans, which can cause malaria.
Mutualism
In mutualism the relationships are complementary. Together both species work together to help each other. This relationship benefits both species. One example of mutualism would be the Oxpecker and Elephant. You may have seen photos of birds congrgating around an elephant and wonder why. This has to do with the interaction of mutualism. The elephant has bugs located on their body. The Oxpecker congregates around the elephants because it eats the bugs off of the body of the elephant. The Oxpecker is gaining nutrients and a supply of energy through consumption of the bugs on the elephant. The elephant is also benefiting by the Oxpecker getting rid of an unwanted nuisance of the elephant.
Commensalism
Commensalism has one species that gains from the other species. The other species has no gain or harm done from the interaction of relationships from that species. An example would be a Robin (bird) and the tree. The Robin benefits from the tree by building a nest in the tree in which to lay eggs. However, the tree does not experience harm from the Robin nesting in the tree. Another example of commensalism is a rabbit and a pine tree. If the rabbit is looking for protection the rabbit can hide near the base of the pine tree, perhaps out of sight from selected predators. The pine tree is not harmed from the rabbit taking protection near the base of the tree. Finally, Remora fish have a special adaptation which allows them to attach themselves to a shark and experience a free ride to another location; the shark is not harmed in any way.
Explore Ecosystems
At each of the links explore a variety of ecosystems:
- Wild City Search: An Urban Ecosystem Game
- Jungle Jeopardy: An Ecosystem Game by Plum Landing
- Make a Mangrove: An Ecosystem Game by Plum Landing
- Feed the Dingo: An Ecosystem Game by Plum Landing
- Mountain Scramble: An Ecosystem Game by Plum Landing
As you interact with the link which take you to different ecosystems think about the following:
- What relationships are present within the ecosystems?
- What happens if there is a low population of a species that depends on each other? Increase?
- What types of biotic and abiotic species are found within each of the ecosystems?
- Who is at the top of the food chain? Bottom?
Implementation into the Classroom
Animal & Ecosystem Drawing Activity
Management Tip – Cut *ample strips (10 cm long by 2 cm wide) of blue (representing water), green (representing food) and brown (representing shelter/habitat) construction paper and sprinkle the throughout the classroom floor. Upon entry, ask students to collect any 9 strips of colored paper from the floor; do not tell them what the colors mean or direct them on which strips to collect; rather, simply instruct them to collect any nine strips of paper.
*For a class of 25, there should be 125-150 strips of each color.
1. Ask students to identify and draw their best depiction of their very favorite wild animal; a brief review of wild vs. domestic may be necessary. The animal sketch will serve as the anchor for the drawing, as students add new components related to their animal and its ecosystem.
2.Have students display their strips of colored paper next to the animal drawing. Assume the role of a wildlife biologist and briefly describe the types of things wildlife biologists do as a career. Indicate one aspect of a wildlife biologist is to attend to the overall health and condition of animals, populations, communities, and ecosystems. In this case you are here to assess the overall condition of the students’ favorite animals (see drawings).
3. Meander about the room, carefully examining each drawing while paying particular attention to the nine strips of paper e.g have the student hold up the strips of paper for everyone to see. Stop by a student who collected equal amounts (3 blue, 3 green, 3 brown) , pronounce them healthy and in great shape. Continue on and select a student who may have chosen combinations of colors which are not equal (1 blue, 5 green, and 3 brown; 2 green, 5 blue, and 2 brown; etc.) indicate that the animal is alive but not thriving; it could be better. Animals whose students only have one of a strip of a particular color are considered to be in danger and it is a very serious situation. Almost certainly, some students will be missing one or more of the three colors e.g. all blue or 4 green and 5 brown. These animals are sadly deceased; they simply didn’t make it. Mix and match the descriptions and encourage students to look for a pattern e.g. what types/amounts of paper strips do healthy animals seem to have; dead animals?
4. Soon students should infer it is better to have all three colors and best to have equal amounts of each color (3). Garner student input for what wild animal need to survive. Ask students to speculate what these colors might represent as they think of what animals need to survive and thrive in nature.
green = food
brown = shelter and space (habitat)
blue = water
5. Ask students to return to their drawings and add each of these elements into the background of their animal drawing. For example, represent a food source(s), types of plants, landscapes, dens, burrows, water source, where it sleeps. Provide colored pencils so the students can accurately depict coloration and more real-world. Many will benefit by researching to find additional information to what they already know or though they know, about their favorite animal. In short, we want students to fill in the drawing by considering all of the elements needed for survival and thriving.
6. As ecology concepts are taught, refer students back to their murals and add visual depictions. For example, include the following concepts: producers and the role of the sun, primary and secondary consumers, food chain/food webs, decomposers, adaptations, carrying capacity, limiting factors, biotics and abiotic factors, autotrophs and heterotrophs, organism relationships, energy flow, habitat, invasive species, etc. Many of these concepts can be modeled directly on the original drawing, however additional paper may need to be attached. In essence, as new concepts are considered and modeled, the original drawings will morph into modified murals.
7. It is vital to understand that this exercise, over time, is far more than an art project. Students should not only model the concepts, but also annotate the drawings with their knowledge of ecological concepts. This can be done directly on the drawing or as side bars attached with string. Both the drawing and annotations will yield a rich source of assessment data for the teacher.
Try it out!
Teacher Time Out: Ecology
How does this connect to the NGSS Progression
DCI: LS1.C Organization for matter and energy flow in organisms: In K-2 the students focus on basic needs of animals as the student progresses in grades 3-5, students build on the basic needs by expanding into how they help the animals function and start to explore plants basic needs. In grades 6-8 the students explore how plants and animals process their foods. As a teacher it is important for us to understand matter and energy through the ecosystem to help the students identify this concept through plants and animals.
|
K-2 |
3-5 |
6-8 |
|
| LS1.C Organization for matter and energy flow in organisms | Animals obtain food they need from plants or other animals. Plants need water and light. | Food provides animals with the materials and energy they need for body repair, growth, warmth, and motion. Plants acquire material for growth chiefly from air, water, and process matter and obtain energy from sunlight, which is used to maintain conditions necessary for survival. | Plants use the energy from light to make sugars through photosynthesis. Within individual organisms, food is broken down through a series of chemical reactions that rearrange molecules and release energy. |
DCI: LS2.B Cycles of matter and energy transfer in ecosystems: Students in K-2 classrooms learn where basic need resources are found on Earth through the DCI of LS1.C and ESS3.A. As grades progress the DCI’s become more specific and break into more categories. Grade band 3-5 starts to explore the flow of energy by focusing on the consumer-prey relationship. There is little depth to matter cycling other than one animal eats another and all energy begins with the sun. This concept is expanded upon in grade band 6-8 grades as students begin to incorporate the movement of matter in nutrient cycles and energy flow through the inclusion of soil and decomposers. In a classroom the teacher needs to have an elaborate understanding of ecosystem interactions.
|
|
K-2 |
3-5 |
6-8 |
| LS2.B Cycles of matter and energy transfer in ecosystems | [Content found in LS1.C and ESS3.A]LS1.C See above.ESS3.A Living things need water, air, and resources from the land, and they live in places that have the things they need. Humans use natural resources for everything they do. | Food provides animals with the materials and energy they need for body repair, growth, warmth, and motion. Plants acquire material for growth chiefly from air, water, and process matter and obtain energy from sunlight, which is used to maintain conditions necessary for survival. | The atoms that make up the organisms in an ecosystem are cycled repeatedly between the living and nonliving parts of the ecosystem. Food webs model how matter and energy are transferred among producers, consumers, and decomposers as the three groups interact within an ecosystem. |
From
https://static.nsta.org/ngss/20130509/AppendixE-DCIProgressionsWithinNGSS_1.pdf
Biomes
A biome is a climate that biotic species are best suited to live in. In each of the biomes you will discover the different environmental characteristics that will impact the biotic species who inhabit that biome. For example, a polar bear is best suited to live in the biome of a tundra. A tundra has extremely low temperatures. If we examine the characteristics of the polar bear we are able to understand why the polar bear is best suited to live in this environment. One characteristic would include the polar bear’s fur. The fur of the polar bear can keep the polar bear warm in extremely low temperatures and allows for the polar bears to blend into the environment.
In each of the six biomes on Earth you will discover plants and animal species that have features that suit them for that living condition.
Earth Biomes
(Biomes Group, Biology 1B class, section 115, at UC Berkeley (Berkeley University of California UC Museum of Paleontology), 2019)
Explore Biomes
Explore the world of Biomes in this simulation found at: https://www.biointeractive.org/classroom-resources/biomeviewer
*Once on the website be sure to click the button “Launch Interactive.” This is located at the top of the page.
When interacting with the simulation:
- What is life like in that Biome?
- What is the climate?
- Compare and Contrast Biomes.
Energy Flow
Food Chain, Food Web, and Ecological Pyramid
A food web, food chain, and ecological pyramid are diagrams used in ecology that show relationships of biotic species. These three different types of diagrams allow us to understand who eats who and about energy and matter patterns. As you learn about these diagrams think about how the energy and matter patterns are present and work through the diagrams.
Food Chain
A food chain is the least complex of the diagrams. A food chain typically has an order starting with a producer then proceeding with the levels of a consumer (primary, secondary, and tertiary). A decomposer may be present. In the food chain the arrows go in one direction indicating the flow of energy from one organism to the next. As animals feed on each other the energy is transferred from one organism to the one who eats that organism. For example, when the fox consumes the Robin, the Robin is passing its energy on to the fox. As the energy is flowing from one level of organisms to the next some energy is lost back into the environment. See an example of a food chain in figure 16.
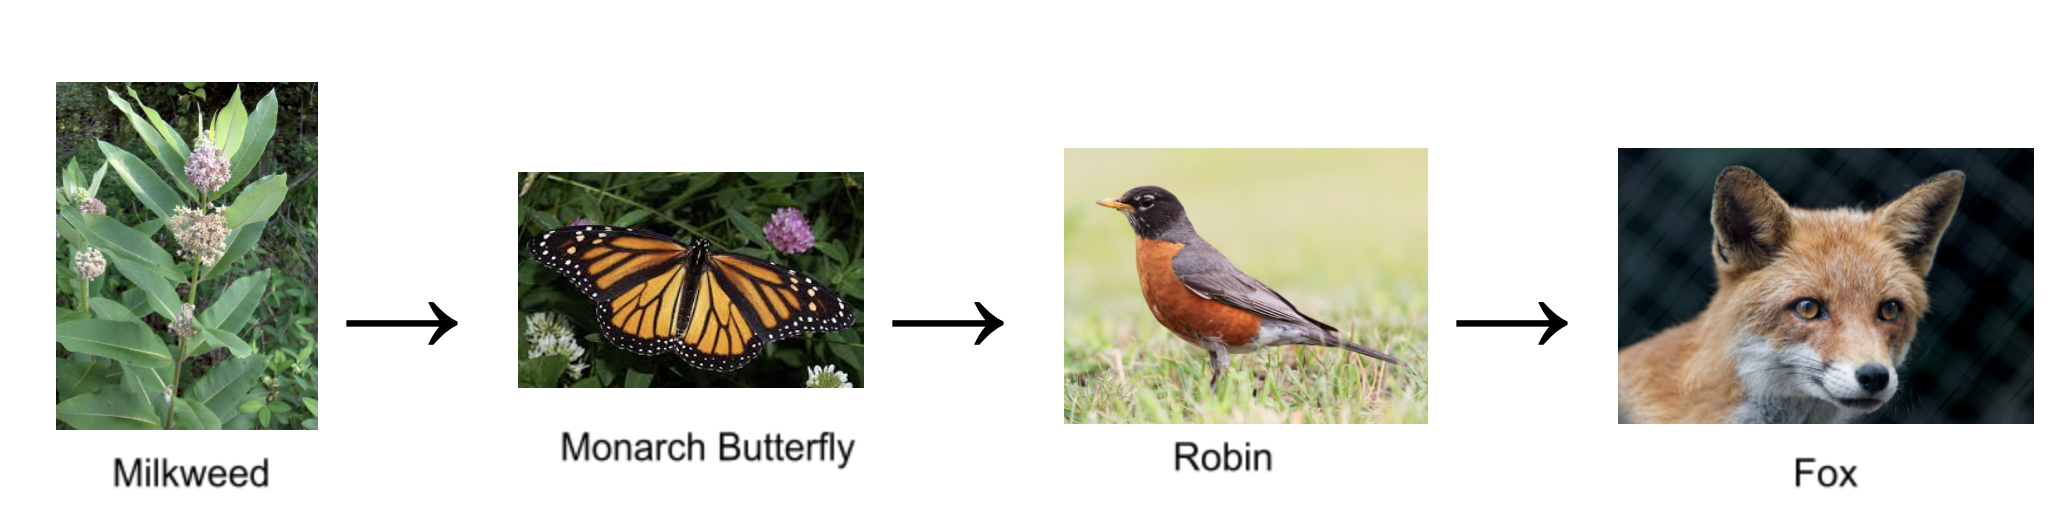
Figure 16: Food Chain in the Midwest
(Harrelson, 2007; Kristof, 2005; Price, 2006; Tambako The Jaguar, 2016)
Food Web
A food web shows multiple relationships within an ecosystem. This diagram can become complicated as there are multiple organisms present. The main source of energy starts with the sun and is absorbed by the producer. The producer passes the energy onto the consumer and the flow continues. Matter is also represented in this cycle. For more information on the matter cycles see “Impact of Energy and Matter on the Ecosystem.” The energy and matter is represented by arrows on the food web. Here is an example of the presence of energy and matter. A fox consumes a rabbit (this is a predator prey relationship). When the fox consumes a rabbit the energy flows from the rabbit to the fox. Energy is still being lost as consumption takes place. When the fox eats the rabbit, matter is also present in the consumption. This matter is broken down into energy. The matter cycles through the fox and is released back to producers (such as plants) from the fox as organic matter as the fox releases feces or decays. Below is an example of a food web in figure 17.
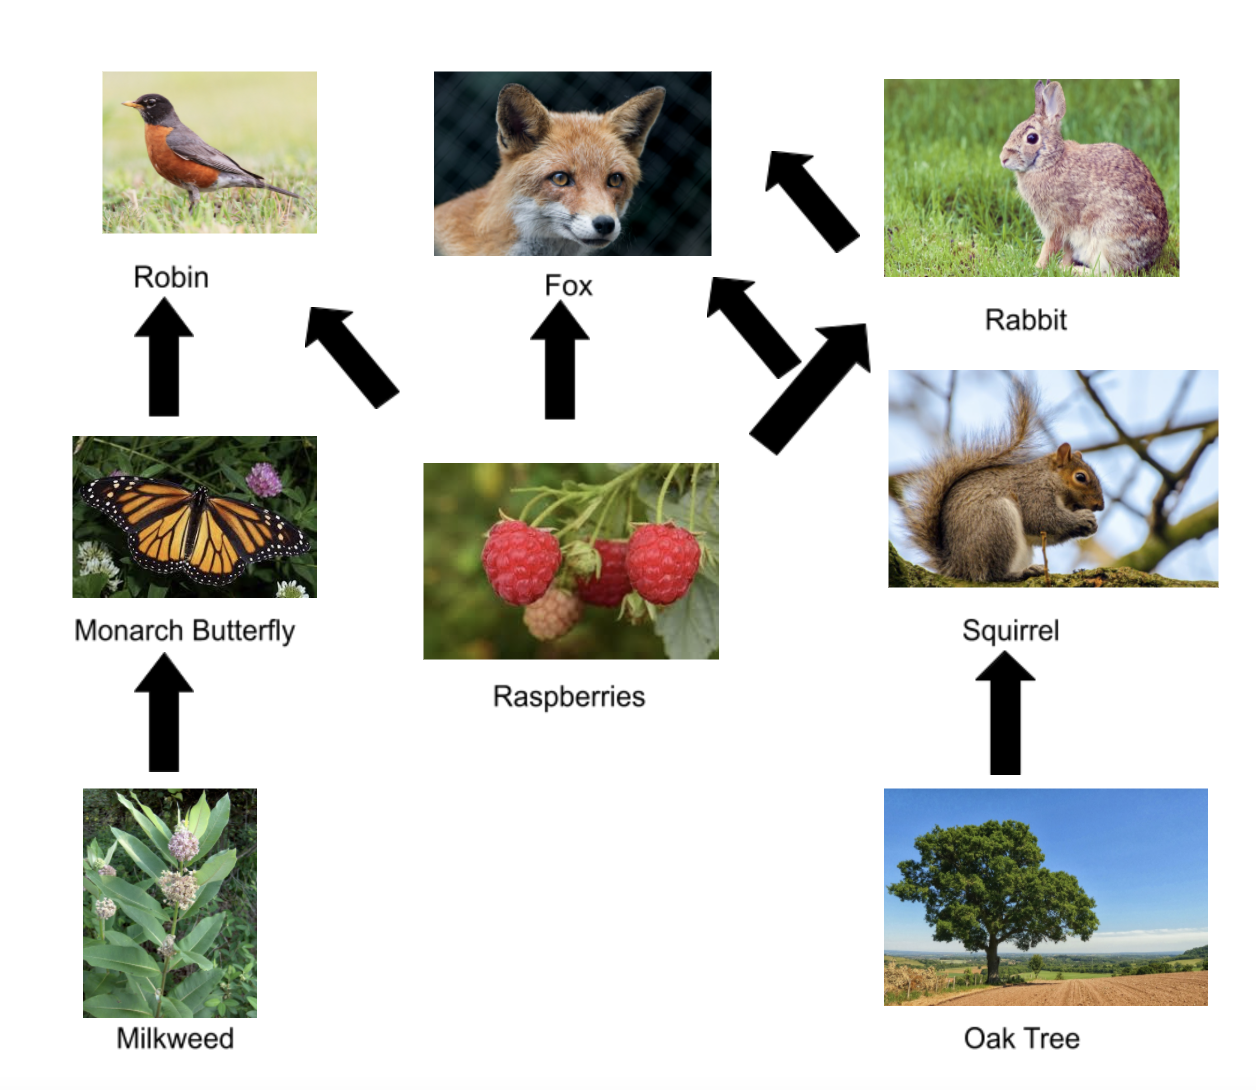
Figure 17: Food Web in the Midwest
(Finn, 2020; Harrelson, 2007; Hodan, 2007; Kristof, 2005; Leung, 2013; Price, 2006; Tambako The Jaguar, 2016; Ulleo, 2018)
Ecological Pyramid
An ecological pyramid is a pyramid that shows the varying levels of organisms. This is similar to the food chain. These levels are decomposer, producer, and the levels of a consumer. The ecological pyramid can show the approximate amount of energy that is consumed by each tier of the consumer, as seen in figure 17 as percentages of approximate energy consumed by each of the levels. This approximate amount of energy consumed means as you move up the pyramid from the bottom the organism needs to consume more food in order to continue to survive. This is because the higher up the organism, the organism does not consume as much energy as the tier below. In figure 17 you can see this amount of the energy difference from the producer in the bottom tier to the fox at the very top of the pyramid. The arrow on the ecological pyramid represents the energy that is lost. The cycling of matter is present in the ecological pyramid as well. As the Robin consumes the Monarch Butterfly energy is transferred from the Robin to the Monarch Butterfly. That matter is converted from energy and cycles through from one organism to the next. As the Robin gets rid of waste as feces matter is released back to the producer or the Milkweed as represented in figure 18.
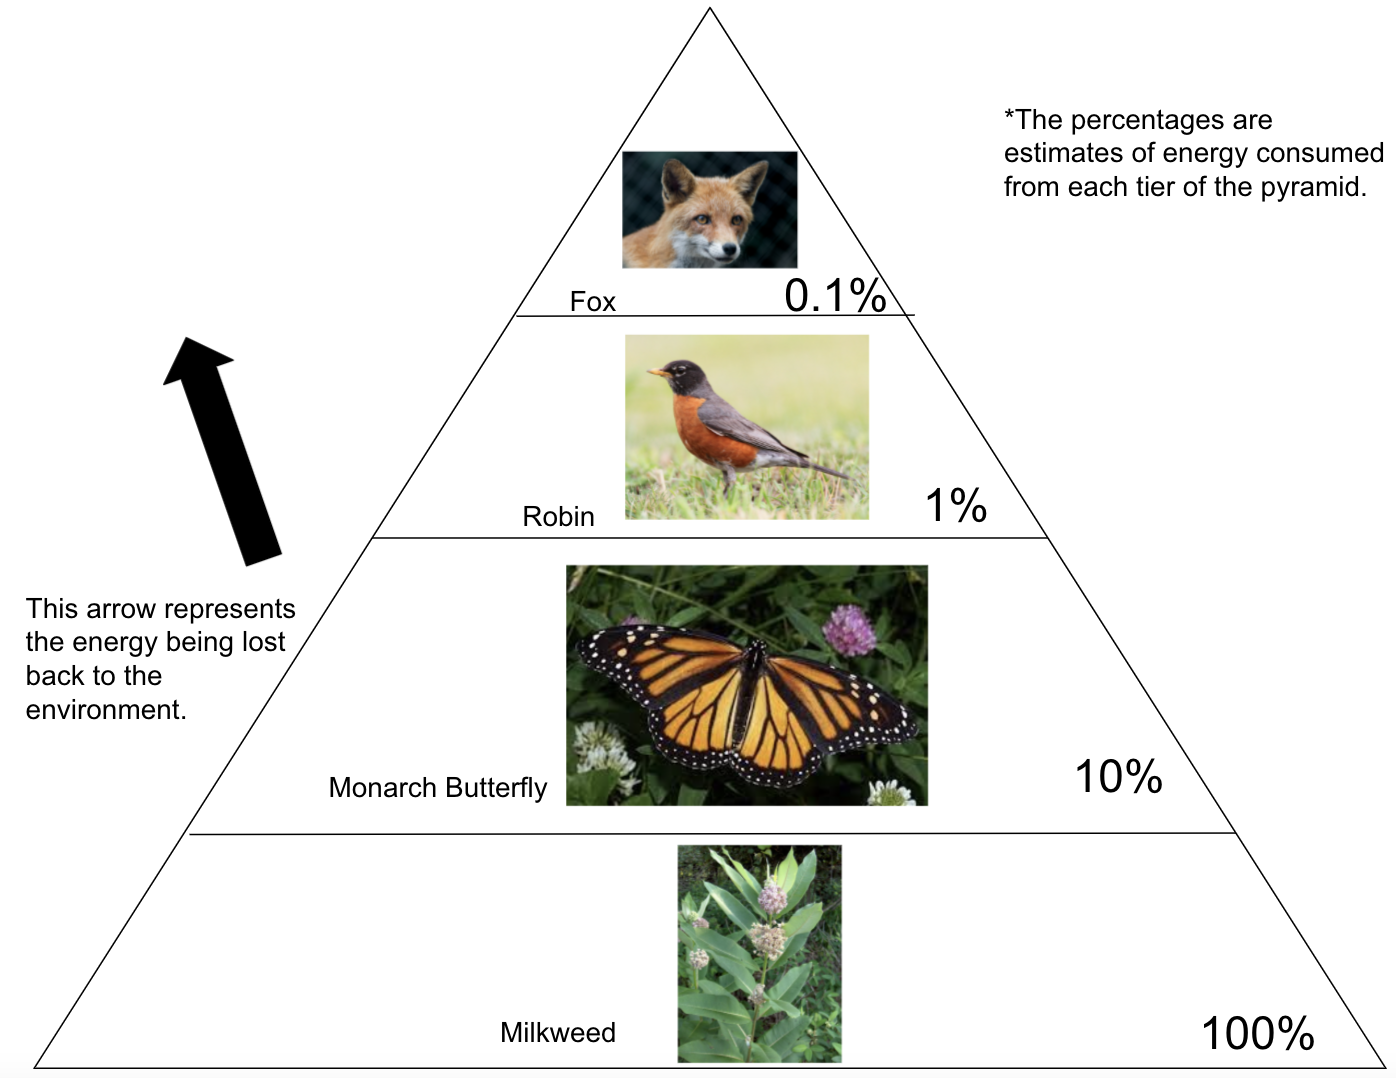
Figure 18: Ecological Pyramid Within the Midwest
(Harrelson, 2007; Kristof, 2005; Price, 2006; Tambako The Jaguar, 2016)
(Finn, 2020; Harrelson, 2007; Hodan, 2007; Kristof, 2005; Leung, 2013; Price, 2006; Tambako The Jaguar, 2016; Ulleo, 2018)
Impact of Energy and Matter on the Ecosystem
Energy
Explore how Energy flows throughout the ecosystem.
Matter
It is critical to differentiate between energy and matter as they both cycle through the environment. There are many ways that matter can cycle throughout the environment for example, the carbon cycle, water cycle, and nitrogen cycle. Click below to explore more about each cycle of matter.
In this video you will examine Energy and Matter discussed together in an ecosystem.
Growth Patterns
In an ecosystem species have relationships with each other. These relationships affect populations of biotic creatures. If one population shifts the other populations that depend on that species will be affected. This could be positive or negative to that species. To examine this further there are patterns to this. These are referred to as patterns of growth. Two growth patterns that we will examine are the J-shaped and the S-shaped growth pattern.
J-shaped Growth Pattern
In a J-shaped growth pattern conditions for the species are favorable. This means the species have the resources needed to survive and thrive producing more of the species. These resources can include food, shelter, safety, and reproduction ability. This J-shaped growth pattern can be seen below in a graph in Figure 19. As the conditions continue to be favorable in the environment the species are able to reproduce creating an upward growth in the population overtime. One example could be with foxes. A fox is towards the top of the food chain so does not have to worry a lot about safety. If the fox population has an abundance of food, then food is a favorable condition for the growth of the fox population because there is enough food to go around for each fox. The foxes will then have an increase in reproduction as there is enough resources to increase the foxes population. Keep in mind this is just one example of a species. For some species it can vary depending on their location on the food chain. There may have to be multiple favorable conditions in order for the species to increase in population.
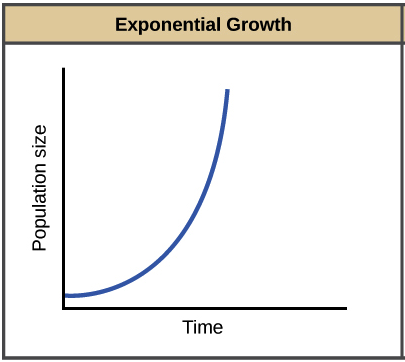
Figure 19: J-shaped Population Curve
(Rye et al., 2016)
S-shaped Growth Pattern
An S-shaped curve starts out as a J-shaped growth pattern. The population of the species grows because the environment conditions allow them to do so. This means there are enough resources such as food, water, and shelter. However, as reproduction continues to grow overtime the conditions of resources may start to lack. For example, the population of their food source may decline. With the decrease in the population’s resources the conditions start to become less favorable for the species. This could result in the population being so large that there is not enough food for every single individual in the population. This results in a decline in reproduction rate resulting in the S-shaped growth pattern seen below in figure 20.
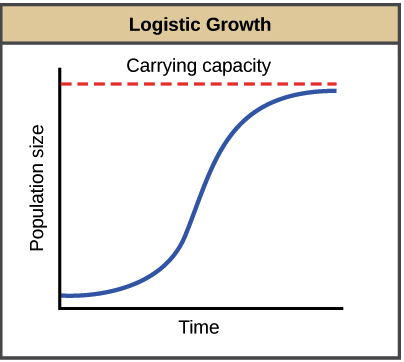
Figure 20: S-shaped Population Curve
(Rye et al., 2016)
Review Concepts – Ecology
- Food chains and how they differ from food webs
- Energy flow through food chains and webs
- Carrying capacity & what makes a “balanced population;” how this might look when depicted on a graph
- Examples of limiting factors within a population and community
- What is meant by biotic & abiotic elements; examples of each
- What is meant by autotrophs & heterotrophs; examples of each
- Ecosystems, communities, and populations and how these are related to each other.
- Consumers, producers, decomposers; examples and key role(s)
- The difference between herbivores, carnivores, omnivores; examples of each
- The nature of prey/predator relationships and where this fits into food chains and webs
- What is meant by an apex predator; examples
- Interdependence and why relationships are important in ecosystems
Practice Quiz – Ecology
Click on this link to check your understanding.
https://docs.google.com/forms/d/1h5qMdMRFGDdP3aVPa2fIZZI7pu5Q-ckQzkL3nyTDVq4/edit
a living component of a biological community
a living component of a biological community
a series of organisms through which energy is passed in the form of food; the flow of energy from one organism to another
an organism which feeds on dead organic material
a network of interconnecting food chains
organisms that produce new organic material from inorganic material with the aid of sunlight; commonly known as plants
an illustration of the relationship between producers and consumers at different trophic levels
a group of individuals belonging to the same species and living in the same geographic area
a curve that occurs when the birth and death rate in a population come closer together and the population size levels off
