
21 Climate vs. Weather
Weather vs. Climate: Formative Assessment
Weather is the short-term atmospheric conditions in an area like, “It’s raining” or “It’s sunny today”. As such, weather can change day to day.
Climate is the usual weather activity that can be expected for an area and time of year such as, “Minnesota is so snowy during the winter” or “Florida is sunny in the summer”. Climate is measured in 30-year intervals, so the term climate change refers to the continual change of the climate over time from what is typically expected to happen.
Some people confuse weather and climate. For example, you may hear something like, “This snowstorm is crazy…we need global warming!” However, this statement confuses weather and climate. A snowstorm that lasts for a few days is a weather event; global warming is part of climate change which is measured over decades. Earth could have its hottest day on record–a weather event–but we cannot call that climate change unless a trend indicating a change in temperature can be measured over a 30-year period.
Key Takeaways
- Weather: what is happening NOW
- Climate: what happens USUALLY
What factors determine whether an area has a hot or cold climate?
L.O.W.E.R. Near Water
- L: Latitude
- Latitudes near the Equator have warmer temperatures.
- Latitudes near the North and South poles have colder temperatures.
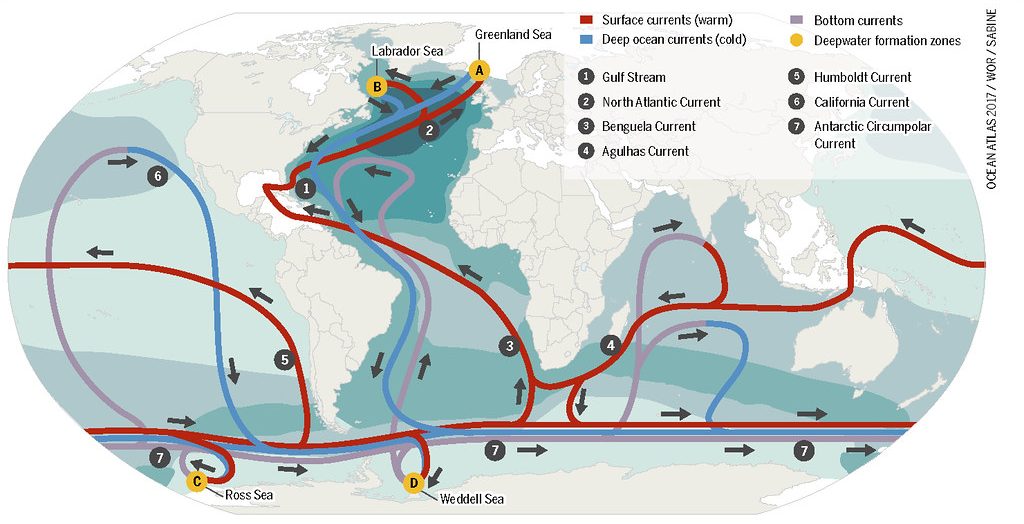
- O: Ocean currents
- The temperature of an ocean current affects the temperature of the air that passes over it.
- Example: The California Current brings cooler air from north to south; therefore, California’s coastal cities tend to have a cooler climate. Conversely, the Gulf Stream carries warmer air from tropical areas to the southeastern United States; therefore, this region tends to have a warmer climate.
- W: Wind and air masses
- Air masses take on the climatic conditions of the area where they are formed. When wind moves these air masses to a new area, they bring the climatic conditions with them which can affect the weather and climate of the new location.
- Example: If the wind or air mass is coming from the Arctic, it will bring colder air to an area. If the wind or air mass is coming from the tropics, it will bring warmer air to an area.
- E: Elevation
- Higher altitudes tend to be cooler, while lower altitudes tend to be warmer. This is because there is less pressure at higher altitudes, so the air expands and cools.
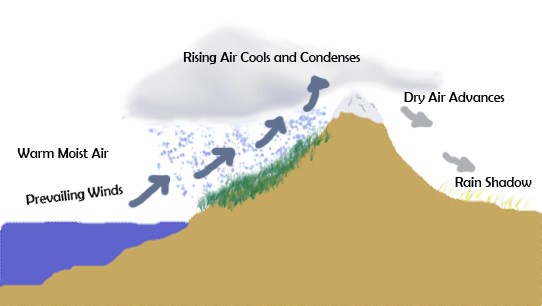
- R: Relief (aka topography)
- When an air mass rises to pass over topography such as a mountain, it expands and cools. This causes precipitation on that side of the mountain. A rain shadow is created because the precipitation cannot pass over the mountain to the other side.
-
- Example: The Sierra Nevada mountain range in California is a topographical feature that affects climate. West of the mountains, moist air comes off the Pacific Ocean. As this air rises to go up the mountains, precipitation occurs; San Francisco, a city west of the Sierra Nevada, is known for having a cool and wet climate. On the other side of the mountain, precipitation is blocked and the area becomes a desert known as a rain shadow; Death Valley, one of the hottest and driest places in the world is located east of the Sierra Nevada.
- Near Water:
- In the summer, water acts like an air conditioner to keep the air temperatures cool. In the winter, water acts like a heater to keep the temperatures from getting too cool.
- Continental climate=far from water; maritime climate=near water.
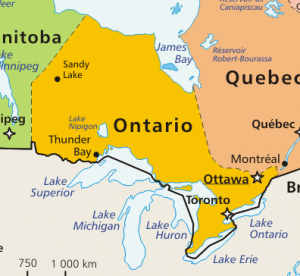
- Example: As seen in the map below, Ontario, Canada–an inland province–has a moderate climate due to its proximity to the Great Lakes. Ontario is cooler in the summer and warmer in the winter than other areas at the same latitude due to the effects of the Great Lakes.
Why Should You Care About Climate Change? Is our state bird, the goldfinch, in danger?
Popular news stories often focus on climate change at a global level–think rising carbon dioxide in the atmosphere or polar bears and melting sea ice. At a national level, wildfires in California or hurricanes on the Atlantic coast are well-covered in the news.
However, climate change is happening now in Iowa and it affects all of us.
According to Iowa scientists, “Time is running out” (Lynch, 2019). Click here to read about the current state of climate change in Iowa.
Additionally, climate change is a key issue in the 2020 presidential election. Since the Iowa caucus plays a key role in national politics, several candidates have visited Iowa town and farms to learn more about the local impacts of climate change. Click here to read more about “How Climate Change in Iowa is Changing U.S. Politics”.
Climate Change in Iowa
The main topics for climate change in Iowa are:
- More precipitation and drought
- Hotter temperaturess
- Impact on agriculture
- Habitat changes
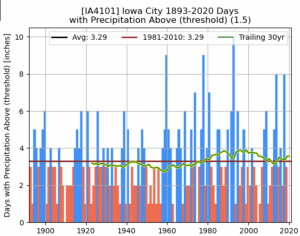
More Precipitation and Drought
According to the Iowa Climate Statement 2012, “In a warmer climate, wet years get wetter and dry years get dryer” (UI Center for Global and Environmental Research, 2012, p. 1).
As a result of climate change and changing weather patterns, Iowa will have:
- An increase in extreme precipitation leading to more floods
- More periods of drought
Graph of the total number of days of two or more days with rain above 2 inches in Iowa City, IA. This graph was generated from: https://mesonet.agron.iastate.edu/
The following shows how precipitation has changed from 1958 to 2012. LINK
This begins to explain some of the conditions we see, droughts out West, flooding in the NorthEast. 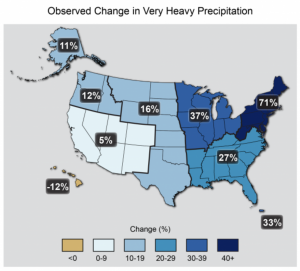
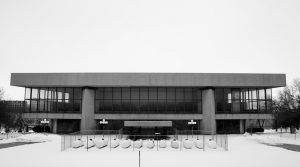
The University of Iowa
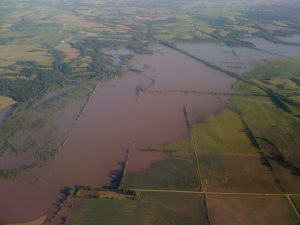
At the University of Iowa, we are still rebuilding campus from the damages sustained during the flood of 2008. The extreme flooding was the result of high precipitation and already-saturated ground; the ground could not absorb anymore water so the Coralville Reservoir and Iowa River overflowed and flooded Iowa’s campus. The water reached more than 20 university buildings resulting in hundreds of millions of dollars in damages.
Click here to see photos of campus during the flood of 2008.
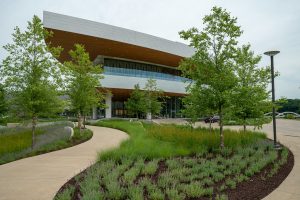
Since 2008, changes have been made:
- The Iowa Flood Center was established to monitor flood risk and to inform the public.
- Some buildings, like Hancher Auditorium and the Voxman Music Building, had to be completely rebuilt and moved to safer locations. The Stanley Museum of Art is the last campus building to be rebuilt; it will reopen in 2022, more than a decade later.
- Dubuque Street by Mayflower Residence Hall, a main thoroughfare into Iowa City, was raised after being closed for a month during the flood of 2008. Construction finished in 2018.
Still, flood events are somewhat unpredictable and likely to increase due to the effects of climate change. This is a risk that the University of Iowa and the surrounding communities will have to navigate in the future.
Hotter Temperatures
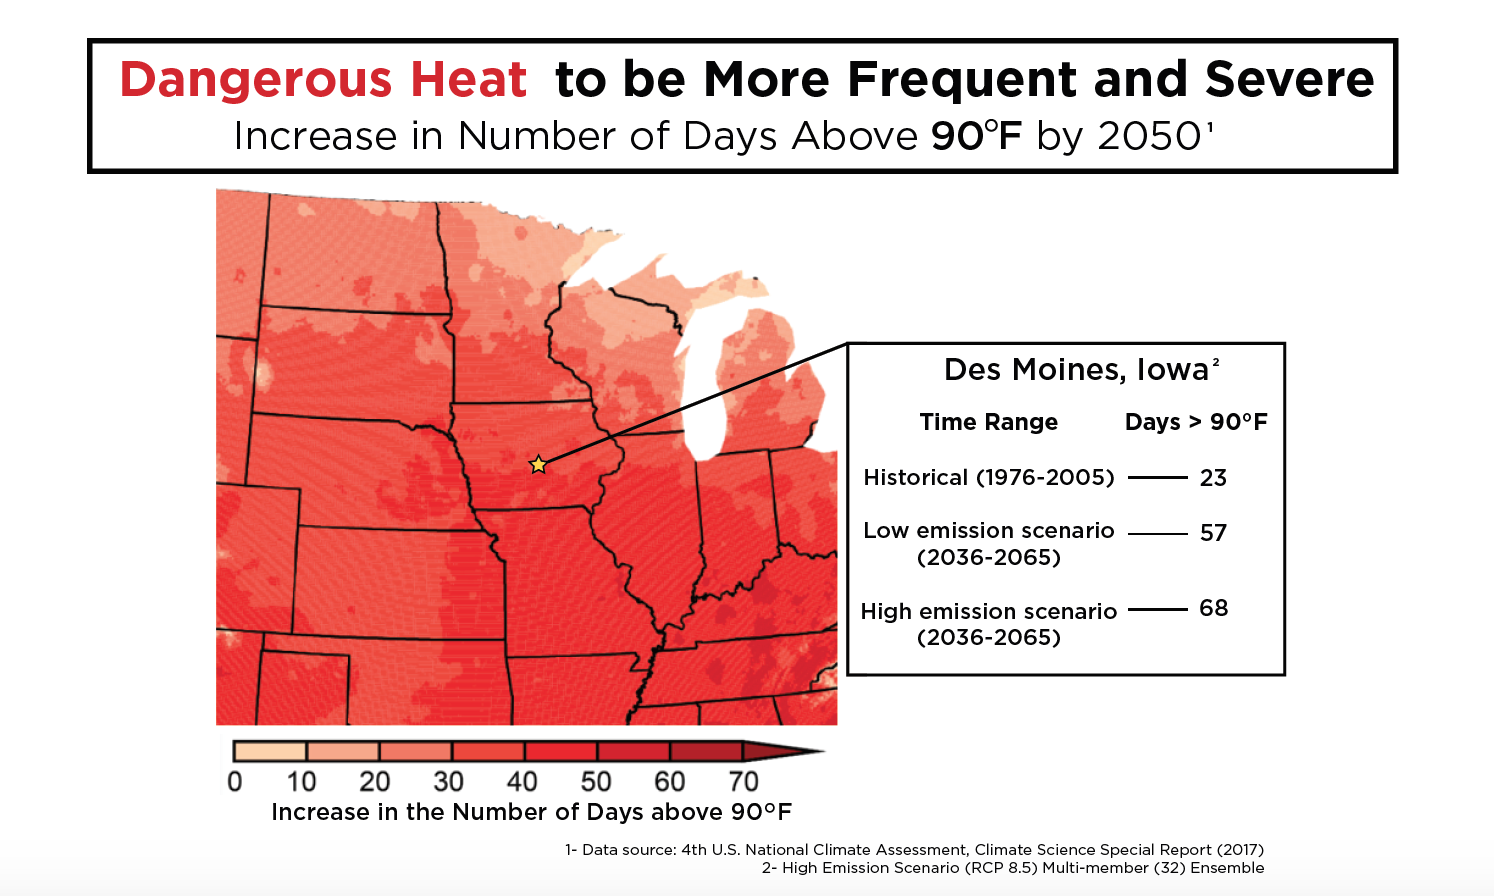
Iowa Climate Statement 2019: “Dangerous Heat Events Will Be More Frequent and Severe”
Based on peer-reviewed data, researchers and educators from colleges and universities across Iowa release the Iowa Climate Statement each year. According to the Iowa Climate Statement 2019, “Dangerous Heat Events Will Be More Frequent and Severe“. Dangerously high temperatures negatively affect the health and safety of the humans and animals who live in Iowa.
Below are three graphics which illustrate the data in the Iowa Climate Statement. Notice that the historical data and projections for temperature are measured in 30 year periods. Climate is measured over a 30-year period, so these models indicate climate change.
The map, below, shows the projected number of days above 90°F in Des Moines, Iowa. The historical number is 23 days, but it could be between 57 and 68 days by 2050 depending on greenhouse gas emissions.
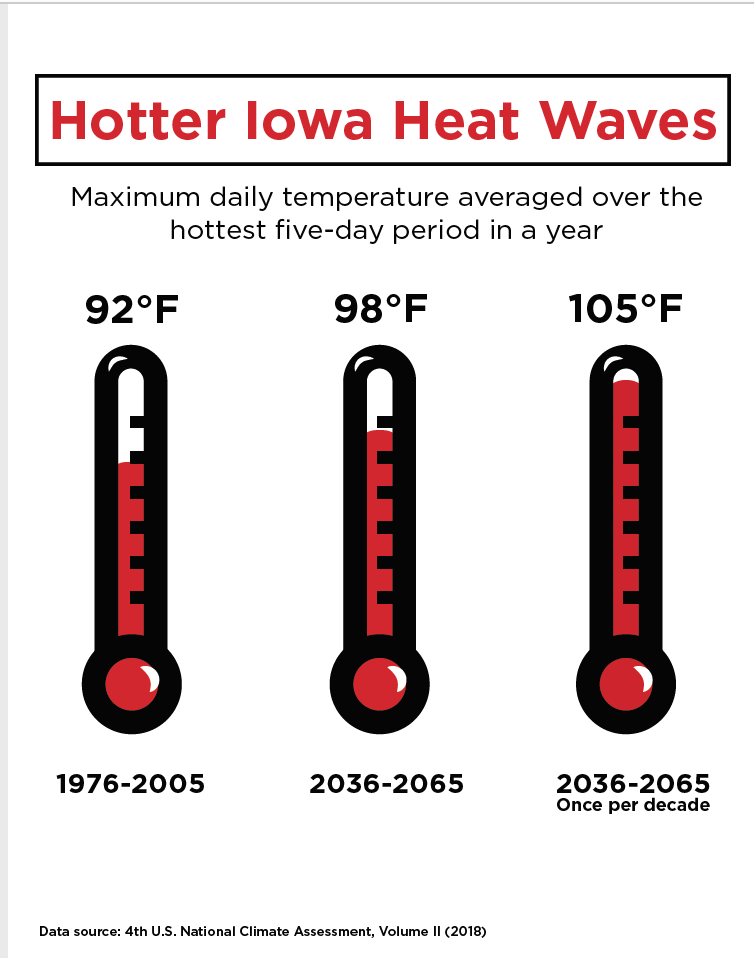
The image, below, shows trends in Iowa heat waves. Historically, the high temperature averaged at 92°F during heat waves. By mid-century, the average will be 98°F and sometimes reach as high as 105°F.
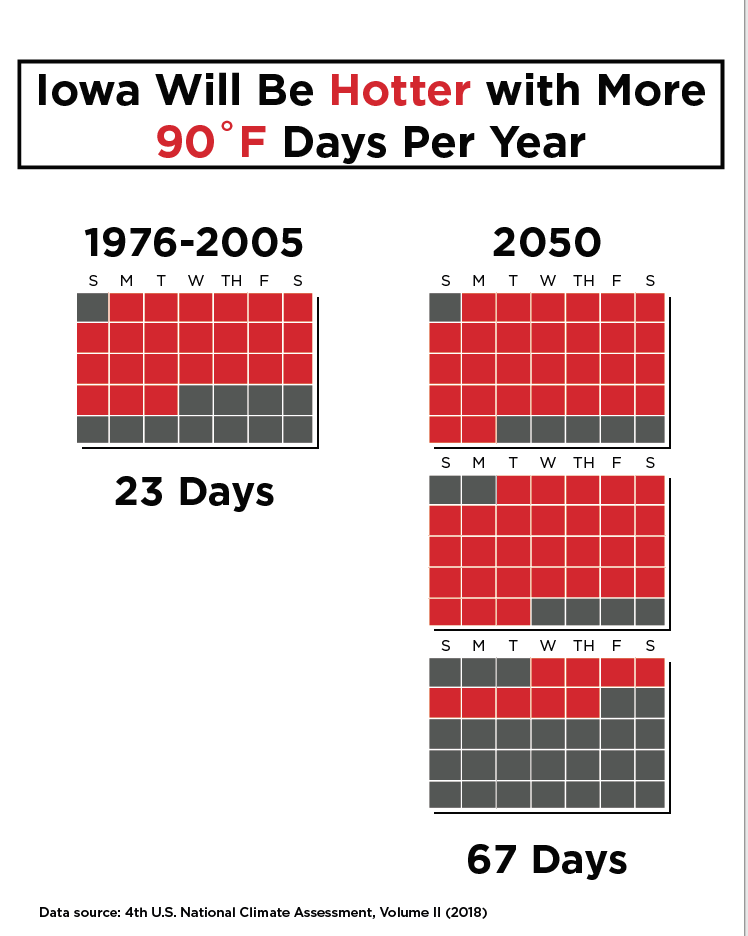
The image, below, shows the number of days in Iowa that are 90°F or hotter. Historical data measured 23 days; by 2050, it is projected to nearly triple to 67 days.
Impact on Agriculture
Agriculture and related industries put billions of dollars in Iowa’s economy each year. Due to climate change and changing weather patterns, several aspects of agriculture will be affected.
- Higher temperatures may lead to longer growing seasons and higher crop yield. However, this can also lead to an increase in agricultural pests.
- Unpredictable weather patterns like temperature and precipitation affect when, and if, farmers are able to harvest their crops.
- There are about 20 million pigs in Iowa (compared to about 3 million humans). These pigs and other livestock are at increased risk for sickness and death due to dangerously high temperatures.
- Increased precipitation and flooding leads to increased soil erosion and poor soil health.
Habitat changes
As temperatures rise and typical weather and climate patterns change, Iowa’s habitat is changing too. Hardiness zones are one way of defining which plants will grow best in an area based on the average temperature. As seen in the maps, below, the range of plants in Iowa is shifting north over time.
- In 1990, Iowa was evenly split between zones 4 (blue) and 5 (dark green).
- In 2015, Iowa is entirely in zone 5 (dark green) with zone 6 (light green) starting to appear at the southern edge of the state.
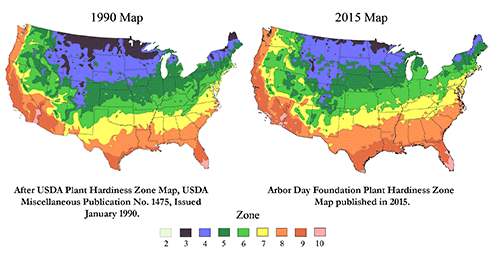
When the plants and trees in Iowa change, it affects all living things–humans, animals, and insects–which must adapt to survive. Notice that the date range (1990-2015) is 25 years. Therefore, the change in hardiness zones indicates climate change in Iowa. As climate change continues, Iowa’s landscape will change in rapid and unpredictable ways.
K-6 Standards
3-LS4-4. Make a claim about the merit of a solution to a problem caused when the environment
changes and the types of plants and animals that live there may change.
What Can You Do About Climate Change?
People are sometimes unmotivated to address climate change because it seems like a problem for the future. Or, they may be daunted by the enormity of the problem and unsure of where to begin. The following article discusses “Why People Aren’t Motivated to Address Climate Change.” Click here to read the article.
If we want to protect Earth and life as we know it, it is critical to take action on climate change immediately. Here are some ways you can get started:
- Calculate your carbon footprint and then take steps to reduce your personal environmental impact.
- Educate yourself about current climate issues–the helpful links chapter in this book has multiple sources about climate science.
- Talk to your politicians about why we need to take action on climate change.
K-6 Standards
K-ESS3-3. Communicate solutions that will reduce the impact of humans on the land, water, air,
and/or other living things in the local environment.
5-ESS3-1. Obtain and combine information about ways individual communities use science
ideas to protect the Earth’s resources and environment.
Sources:
Davy, L.A. (n.d.) Innovations abound at Iowa flood center. Retrieved from https://uiowa.edu/stories/innovations-abound-iowa-flood-center
Lynch, J.Q. (2019). Iowa scientists, educators warn time running out to combat climate change. The Gazette. Retrieved from https://www.thegazette.com/subject/news/government/iowa-scientists-educators-warn-time-running-out-to-combat-climate-change-20190918
Markman, A. (2018). Why people aren’t motivated to address climate change. Harvard Business Review. Retrieved from https://hbr.org/2018/10/why-people-arent-motivated-to-address-climate-change
The Nature Conservancy. (n.d.) Calculate your carbon footprint. Retrieved from https://www.nature.org/en-us/get-involved/how-to-help/consider-your-impact/carbon-calculator/
UI Center for Global and Environmental Research. (2012). Iowa climate statement. Retrieved from https://cgrer.uiowa.edu/sites/cgrer.uiowa.edu/files/pdf_files/IOWA%20CLIMATE%20STATEMENT%20-%20THE%20DROUGHT%20OF%202012_November_19_2012%20FINAL.pdf
UI Center for Global and Environmental Research. (2019). Iowa climate statement. Retrieved from https://iowaenvironmentalfocus.org/iowa-climate-statement/
UI Center for Global and Environmental Research. (2019). [Graphics]. Iowa heat wave graphics. Retrieved from https://iowaenvironmentalfocus.files.wordpress.com/2019/ 09/iowa-heat-wave-posters.pdf
Worland, J. (2019). How climate change in Iowa is changing U.S. politics. Time. Retrieved from https://time.com/5669023/iowa-farmers-climate-policy/
NGSS
K-6 Standards
3-ESS2-2. Obtain and combine information to describe climates in different regions of the world.
| K-PS3-1. | Make observations to determine the effect of sunlight on Earth’s surface. [Clarification Statement: Examples of Earth’s surface could include sand, soil, rocks, and water.] [Assessment Boundary: Assessment of temperature is limited to relative measures such as warmer/cooler.] |
|---|
| K-ESS2-1. | Use and share observations of local weather conditions to describe patterns over time. [Clarification Statement: Examples of qualitative observations could include descriptions of the weather (such as sunny, cloudy, rainy, and warm); examples of quantitative observations could include numbers of sunny, windy, and rainy days in a month. Examples of patterns could include that it is usually cooler in the morning than in the afternoon and the number of sunny days versus cloudy days in different months.] [Assessment Boundary: Assessment of quantitative observations limited to whole numbers and relative measures such as warmer/cooler.] |
|---|
| K-ESS3-2. | Ask questions to obtain information about the purpose of weather forecasting to prepare for, and respond to, severe weather.* [Clarification Statement: Emphasis is on local forms of severe weather.] |
|---|
| 3-ESS2-1. | Represent data in tables and graphical displays to describe typical weather conditions expected during a particular season. [Clarification Statement: Examples of data could include average temperature, precipitation, and wind direction.] [Assessment Boundary: Assessment of graphical displays is limited to pictographs and bar graphs. Assessment does not include climate change.] |
|---|
| 3-ESS3-1. | Make a claim about the merit of a design solution that reduces the impacts of a weather-related hazard.* [Clarification Statement: Examples of design solutions to weather-related hazards could include barriers to prevent flooding, wind resistant roofs, and lightning rods.] |
|---|
| MS-ESS2-5. | Collect data to provide evidence for how the motions and complex interactions of air masses result in changes in weather conditions. [Clarification Statement: Emphasis is on how air masses flow from regions of high pressure to low pressure, causing weather (defined by temperature, pressure, humidity, precipitation, and wind) at a fixed location to change over time, and how sudden changes in weather can result when different air masses collide. Emphasis is on how weather can be predicted within probabilistic ranges. Examples of data can be provided to students (such as weather maps, diagrams, and visualizations) or obtained through laboratory experiments (such as with condensation).] [Assessment Boundary: Assessment does not include recalling the names of cloud types or weather symbols used on weather maps or the reported diagrams from weather stations.] |
|---|
| MS-ESS2-6. | Develop and use a model to describe how unequal heating and rotation of the Earth cause patterns of atmospheric and oceanic circulation that determine regional climates. [Clarification Statement: Emphasis is on how patterns vary by latitude, altitude, and geographic land distribution. Emphasis of atmospheric circulation is on the sunlight-driven latitudinal banding, the Coriolis effect, and resulting prevailing winds; emphasis of ocean circulation is on the transfer of heat by the global ocean convection cycle, which is constrained by the Coriolis effect and the outlines of continents. Examples of models can be diagrams, maps and globes, or digital representations.] [Assessment Boundary: Assessment does not include the dynamics of the Coriolis effect.] |
|---|
DCI
Kindergarten
PS3.B: Conservation of Energy and Energy Transfer
ESS2.D: Weather and Climate
Third Grade
ESS2.D: Weather and Climate
- Scientists record patterns of the weather across different times and areas so that they can make predictions about what kind of weather might happen next. (3-ESS2-1)
- Climate describes a range of an area’s typical weather conditions and the extent to which those conditions vary over years. (3-ESS2-2)
ESS3.B: Natural Hazards
Middle School
ESS2.C: The Roles of Water in Earth’s Surface Processes
- The complex patterns of the changes and the movement of water in the atmosphere, determined by winds, landforms, and ocean temperatures and currents, are major determinants of local weather patterns. (MS-ESS2-5)
- Variations in density due to variations in temperature and salinity drive a global pattern of interconnected ocean currents. (MS-ESS2-6)
ESS2.D: Weather and Climate
- Weather and climate are influenced by interactions involving sunlight, the ocean, the atmosphere, ice, landforms, and living things. These interactions vary with latitude, altitude, and local and regional geography, all of which can affect oceanic and atmospheric flow patterns. (MS-ESS2-6)
- Because these patterns are so complex, weather can only be predicted probabilistically. (MS-ESS2-5)
- The ocean exerts a major influence on weather and climate by absorbing energy from the sun, releasing it over time, and globally redistributing it through ocean currents. (MS-ESS2-6)
Crosscutting concepts
Patterns
Cause and Effect
middle school
Cause and Effect
Systems and System Models
Stability and Change
The short term atmospheric conditions in an area.
The typical weather conditions in an area over a 30-year period.
A significant change over a 30-year period from the typical or expected weather patterns of an area. Modern climate change is human-caused.
A location's distance from the Equator.
A large body of air that takes on the climatic conditions of the area where it is formed.
The physical features of an area of land.
A desert area that is created when a mountain blocks precipitation from passing to one side.
A way of indicating which plants will grow best in an area based on the average temperature.
