
Bundle 6: Climate
Tier 2: Sizing Up Climate Questions
The Iowa Science Standards for 8th grade include focus on asking questions, using evidence, monitoring environmental impact, and collecting data. We combine and support these focus areas in our bundle.
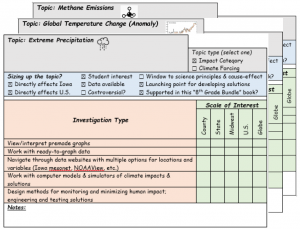
While some textbooks would (at this point) introduce the important concepts from content knowledge about climate, we instead recommend a student-centered process of investigation, and then tying in key concepts as they arise naturally. However, it is important to be able to “size up” a climate or weather question — whether it is from students, or it forms the key concept on a unit you normally teach. The “notecard” pictured below is a compact questionnaire about a climate impact question (e.g. how has intense rainfall changed in the last 100 years in Iowa?) or a climate forcing (e.g., how has atmospheric methane changed over the past 100 years?). We recommend that teachers complete a short questionnaire of this type for each big idea that is tackled in a climate unit. For each example in our book, we provide a filled out card that might help show how the example fits in to the larger bundle, and the classroom-specific interests, goals, and constraints.
The reason that sizing up a topic using this questionnaire, or an equivalent tool, is important — is to determine how a topic fits into the bundle, and what combinations of spatial scale and data sources will work for a given topic or question. Since students cannot take their own data to assess how climate is changing (because 30 year records or longer are required at global scale — and even longer than that at smaller scales), it is important to assess whether data is available for investigating a certain trend at a certain spatial scale. Furthermore, teachers may have in mind a specific balance of studying forcings to the climate system (e.g. greenhouse gases, volcanic eruptions, solar variability) vs. impacts (rainfall, temperature, sea level, heat waves, etc.). And teachers may want to guide the class towards studying solutions to climate forcing (i.e., mitigation, or reducing emissions of greenhouse gases) versus creating solutions to impacts (i.e., adaptation to a changing climate, such as modifying storm drainage systems or changing farming practices).
We recommend that teachers start with a guided example, where students investigate a local climate trend using real-world data. Due to its relevance to every day life here in Iowa, and the good data availability, we recommend starting with intense rainfall. Once the teacher models or guides students through this process with Iowa intense rainfall, the class can begin to answer a broader set of questions.
Over time, teachers and students might build a whole set of climate forcing and impact notecards, as shown below.
Drawing from published assessments of climate change in Iowa, the following variables are thought to be important climate impacts here in Iowa. These are the topics where we would check “Directly effects Iowa” on the notecard.
- Extreme Precipitation (annual average)
- Springtime Extreme Precipitation
- Springtime Total Precipitation
- Fall Soil Temperature
- Average nighttime temperatures
- Flood Frequency / Flood Severity
- Heat Index
- Dew Point
- Absolute Humidity
- Timing of Spring
- Frost Free Days / Growing Degree Days
- Heating Degree Days
- Cooling Degree Days
- Planting (Spring) and Growing (Summer) Soil Moisture (mean, and extremes)
- Summer Maximum Temperatures / Summer Maximum Pavement Temperatures
- Combined impacts on agriculture
While not all of these impacts are covered in our 8th grade bundle, the process of investigating a climate impact is the same each time, and generalizing from our examples is possible. Each time the investigation process includes: (1) identifying a question (e.g., is weather phenomenon X changing over time), (2) identifying a data source that could be used to answer that question, (3) accessing and analyzing the data (often through graphs or in some cases maps), (4) coming to a conclusion supported by evidence, including consideration of the cause-and-effect relationships at play, (5) deciding whether the change represents a problem that needs a solution, and (6) settling in on a solution. For all of the steps involved, one typically chooses as spatial scale to work at (county, state, Midwest, nation, global, etc.). The spatial scale is critical at determining what datasets and sources are used.
