
Bundle 6: Climate
Tier 2, Part A: Investigating Precipitation- Locally, Nationally, and Globally
Tier 2, Part A: Investigating Precipitation- Locally, Nationally, and Globally
Objective:
Students will investigate local climate issues using real-world data.
Overview:
The Iowa Science Standards for 8th grade include focus on asking questions, using evidence, monitoring environmental impact, and collecting data. We combine and support these focus areas in our bundle.
Therefore, the goal of this Tier 2 bundle is to have students investigate a local climate trend using real-world data. Students will begin with a guided example (has rainfall changed in Iowa?). In other words, there is a predetermined question, the location of the data source(s) are given, and a fully worked example is available to the teacher.
The investigation of rainfall in Iowa is meant to serve as a template for further investigations. Many investigations will follow a sequence of (1) identifying a question (e.g., is weather phenomenon X changing over time), (2) identifying a data source that could be used to answer that question, (3) accessing and analyzing the data (often through graphs or in some cases maps), (4) coming to a conclusion supported by evidence, including consideration of the cause-and-effect relationships at play, (5) deciding whether the change represents a problem that needs a solution, and (6) settling in on a solution.
Once the teacher models or guides students through this process with an important Iowa climate impact (intense rainfall), they can begin to answer a broader set of questions.
Big questions:
- What causes rainfall?
- Has rainfall changed in Iowa, nationally and globally over the past 100 years?
Standards addressed:
| MS-ESS2-4 | Develop a model to describe the cycling of water through Earth’s systems driven by energy from the sun and the force of gravity. |
| MS-ESS2-5 | Collect data to provide evidence for how the motions and complex interactions of air masses results in changes in weather conditions. |
| MS-ESS2-6 | Develop and use a model to describe how unequal heating and rotation of the Earth cause patterns of atmospheric and oceanic circulation that determine regional climates. |
| MS-ESS3-5 | Ask questions to clarify evidence of the factors that have caused the rise in global temperatures over the past century. |
Tier in depth:
Part 1
Overview: The goal of Tier 2 is to have students investigate local climate issues, using real-world data. Students will begin with a guided example, with a predetermined question, where they will investigate forcing (what is happening), then, what is the cause, the impact and finally, what can be done/should anything be done? A guided template is below, including resources, to help students with the first iteration.
At the conclusion of this guided inquiry investigation, students will branch off into an open investigation. Students will be given a range of investigations, including open to their interest area, to explore and learn about. They will work in groups but be broken into jigsaw groups to make a consensus statement, supported by the data, with an overall climate statement.
Background Knowledge: What causes rainfall? Heavy rainfall? The science behind precipitation:
Rainfall occurs when the sun causes water on earth’s surface to evaporate, creating water vapor that rises upwards through the atmosphere, condenses, and becomes heavy enough to fall back to earth under the influence of gravity. When warm air rises it cools, causing moisture to fall out as precipitation. Warmer air is capable of holding more moisture, leading to extreme precipitation events. As the planet warms, it is predicted that large areas of earth’s surface will experience a greater frequency of extreme precipitation that could damage essential infrastructure, or potentially lead to flooding (IPCC). Nationally, there has been an increase in the portion of the United States that experiences extreme, single-day precipitation events, going back to the early 20th century, with nine of the top 10 years occurring since 1990 (EPA). On a local level, the state of Iowa has seen an upward trend in the number of days that experience more than 1.25 inches of rainfall. Local climatic changes such as these can negatively impact crop production, contributing to delays in planting and harvesting, while also degrading the quality of surface waters (Globalchange.gov).
Probing Question: Has rainfall changed in Iowa, nationally and globally over the past 100 years? Collect data to determine your answer to this question, using real-world data.
Investigation: One option is to look at the number of days with heavy rainfall.
That first starts with asking – how much rainfall is “heavy”?
A commonly used definition is 2” per day – but it would be an opportunity to think about impacts of heavy rain — such as road flooding, flash floods, interruption to businesses, basement flooding, combined sewer overflows, etc. – and see what levels of rain have caused local impacts in the past. The number can be changed to see how different numbers impact the data table. For example, 1 or 1.25 or 1.5 inches.
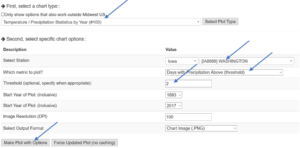
BEGIN INVESTIGATION
-
Make plot #100 in the “yearly” section
-
“Select station” to somewhere “local” to you
-
“Which metric to plot” change to “Days with Precipitation Above (Threshold)
-
“Threshold” change to 2 (signifies days with 2 inches of rain)
-
Select “Make Plot with Options”
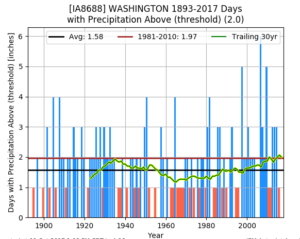
o Scroll down to see graph of the data
o Discuss and analyze
Additional Readings/resources: Have students read one or more of the following local, national, and global resources and newspaper articles to get a broader, yet Iowa-based, perspective on the impact a changing climate can have on precipitation.
Local (Iowa) Viewpoint:
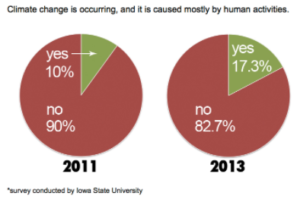
Wacky weather changing Iowans’ climate change perceptions
http://www.thegazette.com/2013/08/10/wacky-weather-changing-iowans-climate-change-perception
Cedar Rapids Gazette (Orlan Love) – August 10, 2013
Results from a 2013 study conducted by ISU suggest that farmers’ perceptions about climate change are evolving. Some attribute this shift in opinion to extreme weather events associated with widespread drought in 2012, followed by an exceptionally wet 2013. Notable changes to Iowa’s climate include increased humidity, greater annual precipitation, more frost-free days, and more extreme weather events, which is likely the strongest signal of a changing climate in our state.
Iowa land use influences climate, state climatologist says
Cedar Rapids Gazette (Erin Jordan) – May 21, 2017
An interview with Iowa state climatologist Harry Hillaker where he discusses his role, how it has changed during his career, and the impact that land use can have on climate.
Rainfall Ties 1988 Record
Waterloo/Cedar Falls Courier (Emily Graham) – May 9, 2003
Heavy rainfalls in early May 2003 tied records that had stood for 25 years. While weather forecasters didn’t anticipate flooding, farmers were forced to delay the timing of getting crops in the ground, potentially diminishing yields.
Iowa Climate Statement 2017: It’s not just heat, it’s humidity
Des Moines Register (Gene Takle and Betsy Stone – Iowa View Contributors) – August 22, 2017
A recent statement issued by science faculty and researchers, describes the impact that heightened humidity levels can have on Iowa’s agriculture industry. Stresses include increased frequency in extreme rain events, warmer overnight temperatures, and longer dew periods that can contribute to delayed planting and harvesting, in addition to elevated costs associated with drying grain.
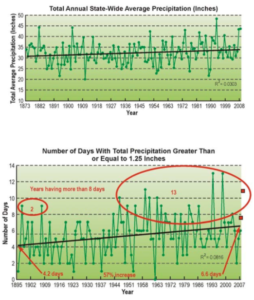
Climate Change Impacts on Iowa 2010
Report to the Governor and the Iowa General Assembly (Iowa Climate Change Impacts Committee)
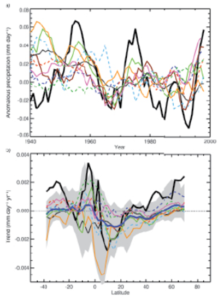
A comprehensive report and summary completed in 2010 that takes an in-depth look at how Iowa’s climate is changing, and the associated consequences to agriculture, flora and fauna, public health, and Iowa’s economy, infrastructure, and emergency services. Of particular interest are the findings related to an upward trend in average annual statewide precipitation (top), and frequency of local (Cedar Rapids) extreme rainfall events (bottom).
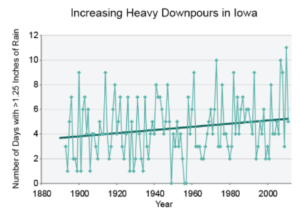
Increasing Heavy Downpours in Iowa
http://www.globalchange.gov/browse/multimedia/increasing-heavy-downpours-iowa
Iowa is the nation’s top corn and soybean producing state. These crops are planted in the spring. Heavy rain can delay planting and create problems in obtaining a good stand of plants, both of which can reduce crop productivity. In Iowa soils with even modest slopes, rainfall of more than 1.25 inches in a single day leads to runoff that causes soil erosion and loss of nutrients and, under some circumstances, can lead to flooding. The figure shows the number of days per year during which more than 1.25 inches of rain fell in Des Moines, Iowa. Recent frequent occurrences of such events are consistent with the significant upward trend of heavy precipitation events documented in the Midwest. (Figure source: adapted from Takle 2011)
National/Regional Viewpoint:
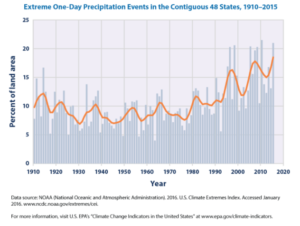
Climate Change Indicators: Heavy Precipitation
https://www.epa.gov/climate-indicators/climate-change-indicators-heavy-precipitation
This figure shows the percentage of the land area of the contiguous 48 states where a much greater than normal portion of total annual precipitation has come from extreme single-day precipitation events. The bars represent individual years, while the line is a nine-year weighted average.
Observed U.S. Trend in Heavy Precipitation
http://www.globalchange.gov/browse/multimedia/observed-us-trend-heavy-precipitation
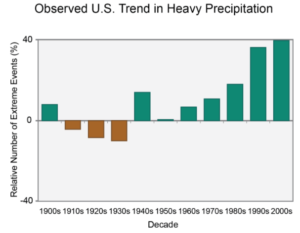
One measure of a heavy precipitation event is a 2-day precipitation total that is exceeded on average only once in a five-year period, also known as a once-in-five-year event. As this extreme precipitation index for 1901-2012 shows, the occurrence of such events has become much more common in recent decades. Changes are compared to the period 1901-1960, and do not include Alaska or Hawai‘i. The 2000s decade (far right bar) includes 2001-2012. (Figure source: adapted from Kunkel et al. 2013).
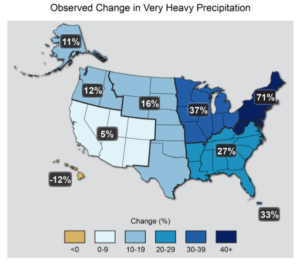
Observed Change in Very Heavy Precipitation
http://www.globalchange.gov/browse/multimedia/observed-change-very-heavy-precipitation-0
The map shows percent increases in the amount of precipitation falling in very heavy events (defined as the heaviest 1% of all daily events) from 1958 to 2012 for each region of the continental United States. These trends are larger than natural variations for the Northeast, Midwest, Puerto Rico, Southeast, Great Plains, and Alaska. The trends are not larger than natural variations for the Southwest, Hawai‘i, and the Northwest. The changes shown in this figure are calculated from the beginning and end points of the trends for 1958 to 2012. (Figure source: updated from Karl et al. 2009).
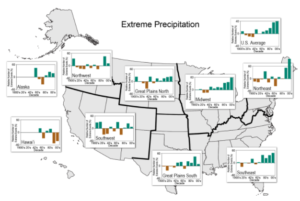
Extreme Precipitation
http://www.globalchange.gov/browse/multimedia/extreme-precipitation
Heavy downpours are increasing nationally, with especially large increases in the Midwest and Northeast. Despite considerable decadal-scale natural variability, indices such as this one based on 2-day precipitation totals exceeding a threshold for a 1-in-5-year occurrence exhibit a greater than normal occurrence of extreme events since 1991 in all U.S. regions except Alaska and Hawai‘i. Each bar represents that decade’s average, while the far right bar in each graph represents the average for the 12-year period of 2001-2012. Analysis is based on 726 long-term, quality-controlled station records. This figure is a regional expansion of the national index in Figure 2.16 of Chapter 2. (Figure source: updated from Kunkel et al. 2013).
Climate Impacts in the Midwest
https://19january2017snapshot.epa.gov/climate-impacts/climate-impacts-midwest_.html
The Midwest has gotten warmer, with average annual temperatures increasing over the last several decades. Between 1900 and 2010, the average air temperature increased by more than 1.5°F. The rate of increase in temperature has accelerated in recent decades, particularly nighttime and winter temperatures. Precipitation is greatest in the eastern part of the Midwest and less towards the west. Heavy downpours are already common, but climate change is expected to intensify storms and lead to greater precipitation across the entire region during this century. Annual precipitation has already risen by as much as 20% in some areas.
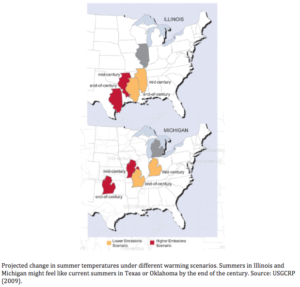
Projected change in summer temperatures under different warming scenarios. Summers in Illinois and Michigan might feel like current summers in Texas or Oklahoma by the end of the century. Source: USGCRP (2009).
Global Viewpoint: Student view a selection of resources, including searching for their own resources, that address global precipitation.
New Satellite Boosts Research on Global Rainfall and Climate
Scientists deploy a new tool to help understand global precipitation.
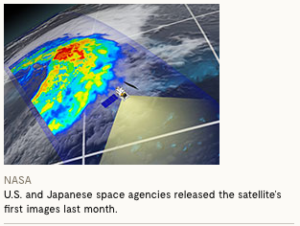
http://e360.yale.edu/features/new_satellite_boosts_research_on_global_rainfall_and_climate
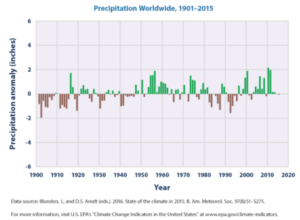
Climate Change Indicators: U.S. and Global Precipitation
Students can investigate, via selecting a view along the bottom of the screen, if they want to look at national or global data.
https://www.epa.gov/climate-indicators/climate-change-indicators-us-and-global-precipitation
Increasing Atmospheric moisture content:
https://www.ipcc.ch/publications_and_data/ar4/wg1/en/ch9s9-5-4-2.html
Validation of sources: Students will fill out the following guide as a validation tool that their sources are legitimate.
4-Point Check
Is this a trustworthy, scientific source?
My source is written to inform and educate.
It’s NOT:
Trying to sell something.
Made for entertainment.
Opinion or propaganda.
My source has good authority.
It IS:
Written by someone inside the field.
Affiliated with a governmental or well-respected scientific organization
Peer-reviewed by subject matter experts.
Using citations and references.
My source is reliable.
It IS:
Published, with an identifiable ISBN number or “doi.”
Stable, and will be there next time I visit the website.
Written recently or updated regularly.
My source is thorough.
It is NOT:
Incomplete, or a work-in-progress.
Missing relevant information.
Conclusion: What did you determine is happening with precipitation in Iowa, nationally and globally, over the past 100 years? What is your supporting documentation?
- Is it really changing? Why does it matter?
Students can answer is it really changing. Then, they can list, discuss things that are impacted by this. Possibly link article from newspaper talked about flooding, bugs, illness/human health, etc…
- What might be the causes of the change in precipitation?
CHARLIE AND SCOTT
Experts:
Solutions:
