
Bundle 6: Climate
Tier 2, Part B: Drought in a Changing Climate
Tier 2, Part B: Drought in a Changing Climate
Objective:
Students investigate local climate issues, using real-world data.
Overview:
The goal of Tier 2 is to have students investigate local climate issues, using real-world data. Students will begin with a guided example, with a predetermined question, where they will investigate forcing (what is happening), then, what is the cause, the impact and finally, what can be done/should anything be done? A guided template is below, including resources, to help students with the first iteration. At the conclusion of this guided inquiry investigation, students will branch off into an open investigation. Students will be given a range of investigations, including open to their interest area, to explore and learn about. They will work in groups but be broken into jigsaw groups to make a consensus statement, supported by the data, with an overall climate statement.
Big questions:
- What is drought?
- How does drought affect humans locally and globally?
- Are droughts more common now than they used to be?
Standards addressed:
| MS-ESS2-4 | Develop a model to describe the cycling of water through Earth’s systems driven by energy from the sun and the force of gravity. |
| MS-ESS2-5 | Collect data to provide evidence for how the motions and complex interactions of air masses results in changes in weather conditions. |
| MS-ESS2-6 | Develop and use a model to describe how unequal heating and rotation of the Earth cause patterns of atmospheric and oceanic circulation that determine regional climates. |
| MS-ESS3-2 | Analyze and interpret data on natural hazards to forecast future catastrophic events and inform the development of technologies to mitigate their effects. |
| MS-ESS3-3 | Apply scientific principles to design a method for monitoring and minimizing a human impact on the environment. |
| MS-ESS3-4 | Construct an argument supported by evidence for how increases in human population and per-capita consumption of natural resources impact Earth’s systems. |
| MS-ESS3-5 | Ask questions to clarify evidence of the factors that have caused the rise in global temperatures over the past century. |
Tier in depth:
Background Info: Drought is an insidious hazard of nature. It is often referred to as a “creeping phenomenon” and its impacts vary from region to region. Drought can therefore be difficult for people to understand. It is equally difficult to define, because what may be considered a drought in, say, Bali (six days without rain) would certainly not be considered a drought in Libya (annual rainfall less than 180 mm). In the most general sense, drought originates from a deficiency of precipitation over an extended period of time–usually a season or more–resulting in a water shortage for some activity, group, or environmental sector. Its impacts result from the interplay between the natural event (less precipitation than expected) and the demand people place on water supply, and human activities can exacerbate the impacts of drought. Because drought cannot be viewed solely as a physical phenomenon, it is usually defined both conceptually and operationally. (University of Nebraska)
What is drought?
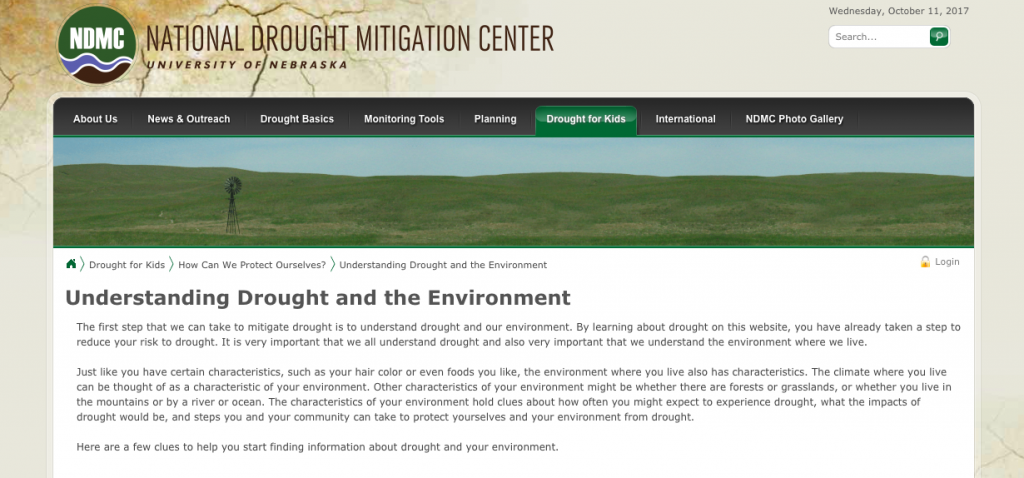
(https://drought.unl.edu/Education/DroughtBasics.aspx)
More information: http://droughttest.unl.edu/DroughtforKids/HowCanWeProtectOurselves/UnderstandingDroughtandtheEnvironment.aspx
Initial Engagement Activity: One way to begin the investigation is to bring in a panel of Iowa farmers to open a discussion about how drought has been affecting their crops for the past season and/or years, in comparison. The goal with this activity is to get students to understand the impacts of climate change on agriculture, which is one of the top industries in Iowa. Students will have the opportunity to connect with community members on a personal level about the impact droughts have had on their community. Students should also get a good idea if drought is more common today than it was years ago.
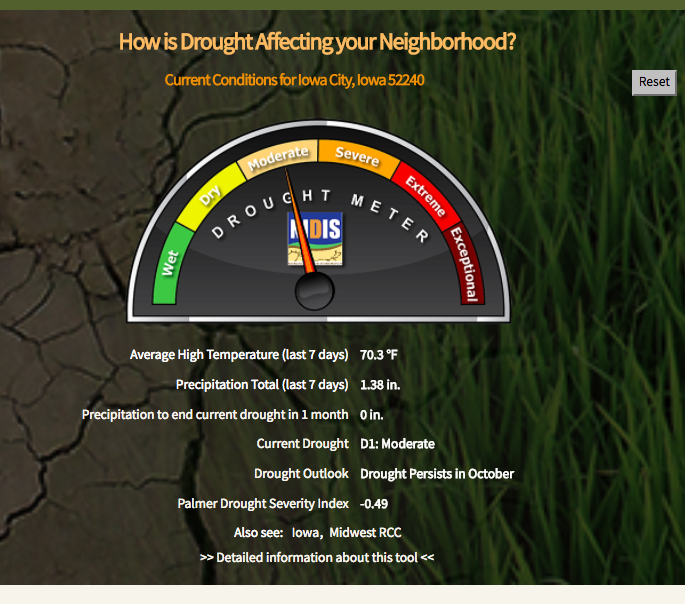
A follow up activity would be to have students visit https://www.drought.gov/drought/states/iowa and type in their zip code to see how affected is their area and pick out certain areas within Iowa that are impacted by the drought. Then proceed to have them look up various locations in the U.S.
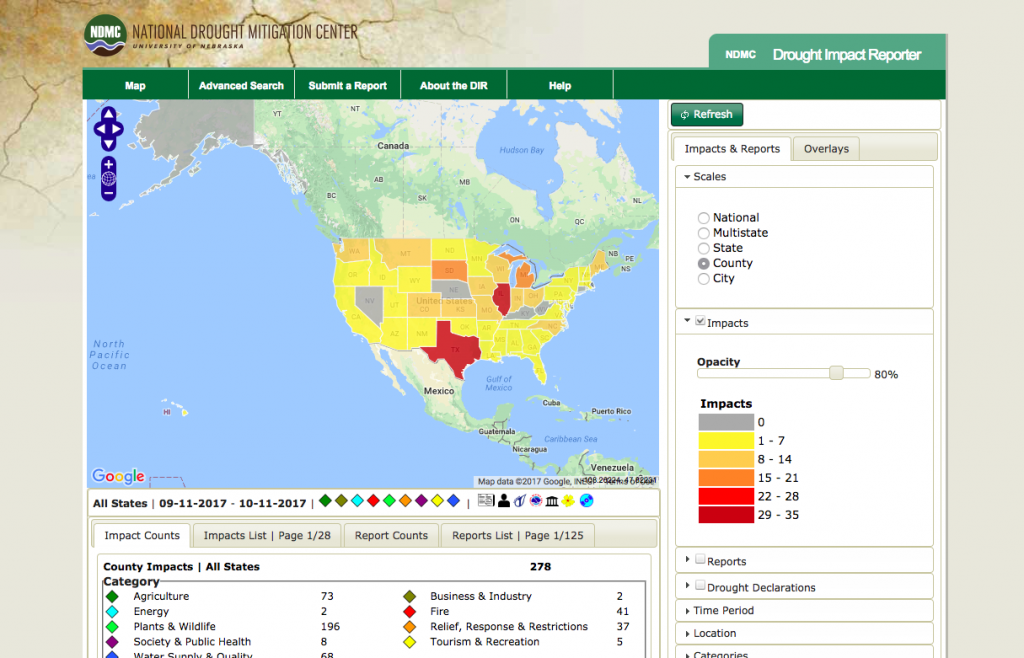
Another Website students would explore in this follow up activity is http://droughtreporter.unl.edu/map/ and discover how drought is affecting various states and counties.
List of Resources:
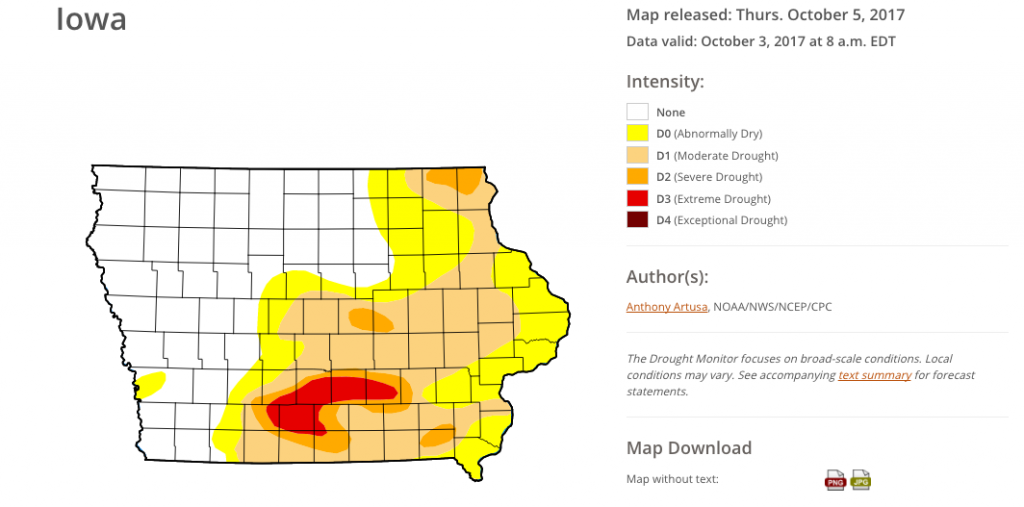
LOCAL: Iowa Drought Map for October 5, 2017
http://droughtmonitor.unl.edu/CurrentMap/StateDroughtMonitor.aspx?IA
Iowa Climate Statement: The drought of 2012
In a warmer climate, wet years get wetter and dry years get dryer. And dry years get hotter ‐ that is
precisely what happened in Iowa this year. We can expect Iowa to experience higher temperatures
when dry weather patterns predominate. The latest science, based on overwhelming lines of physical
evidence, indicates we can expect dry periods to be more frequent as soon as the 2020s.
Local Media on the severity of the droughts in Iowa:
The Gazette
Headline: Washington, Keokuk counties eligible for natural disaster help due to drought
The droughts in Iowa during the summer of 2017 were so extreme that they fit the criteria for a natural disaster. 10 counties were listed as primary natural disaster areas, therefore, making these counties eligible for federal financial aid. This establishes a direct relationship between the economic impact of the consequences of Climate Change.
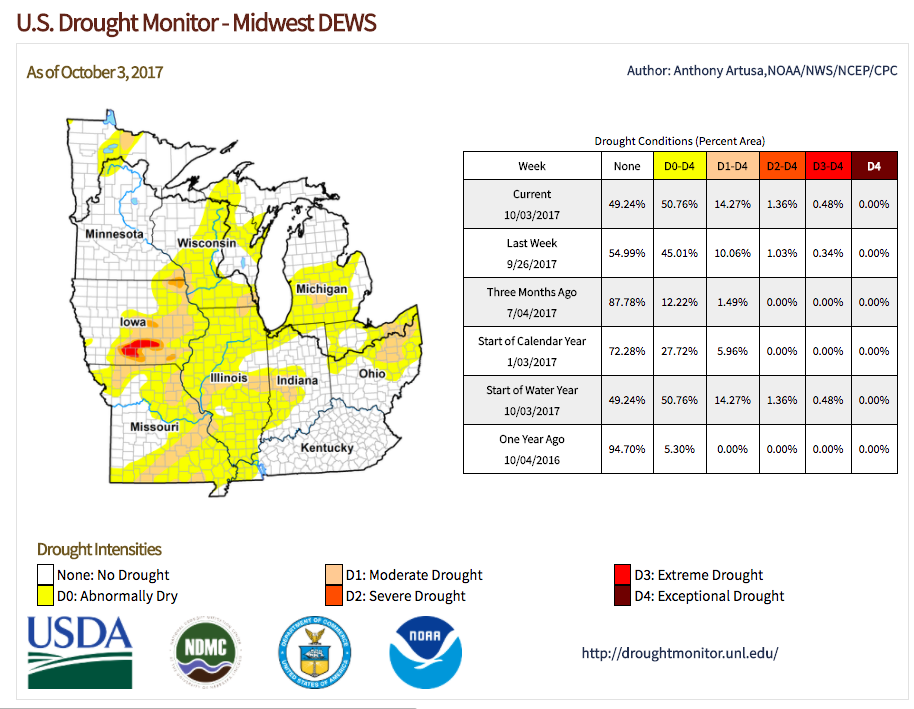
REGIONAL:
One-category degradations were made to the drought depiction in northern and central Ohio, far western Kentucky, northern and eastern portions of Wisconsin, southern and eastern Iowa, parts of Missouri, and western Upper Michigan. Where positive rainfall departures during the past 30-days generally ranged from 2-4 inches (or more), one-category improvements were made. This included Minnesota and portions of northwestern Iowa.
( https://www.drought.gov/drought/dews/midwest )
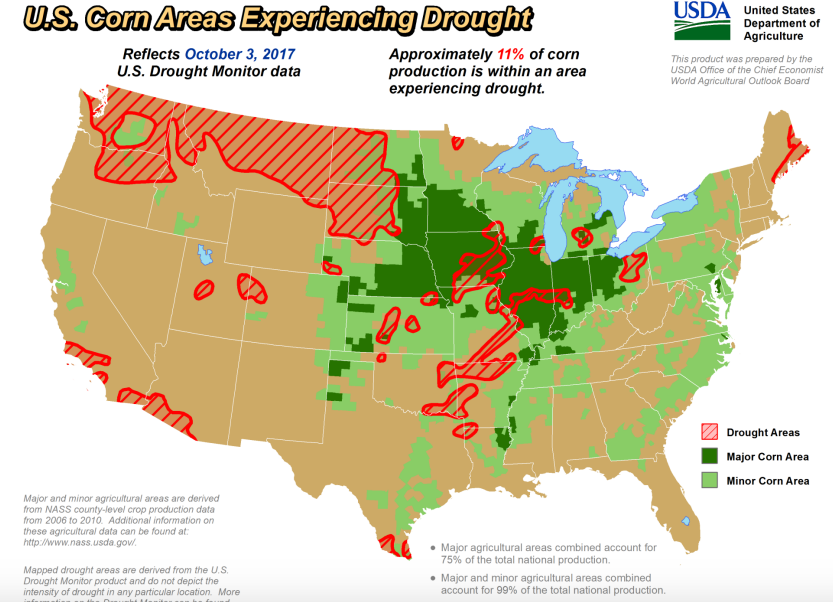
NATIONAL: Map of Corn Production Regions Experiencing Droughts
This map, from the USDA, shows the areas in the U.S where corn is grown and areas in which there are currently droughts occurring.
https://www.usda.gov/oce/weather/Drought/AgInDrought.pdf
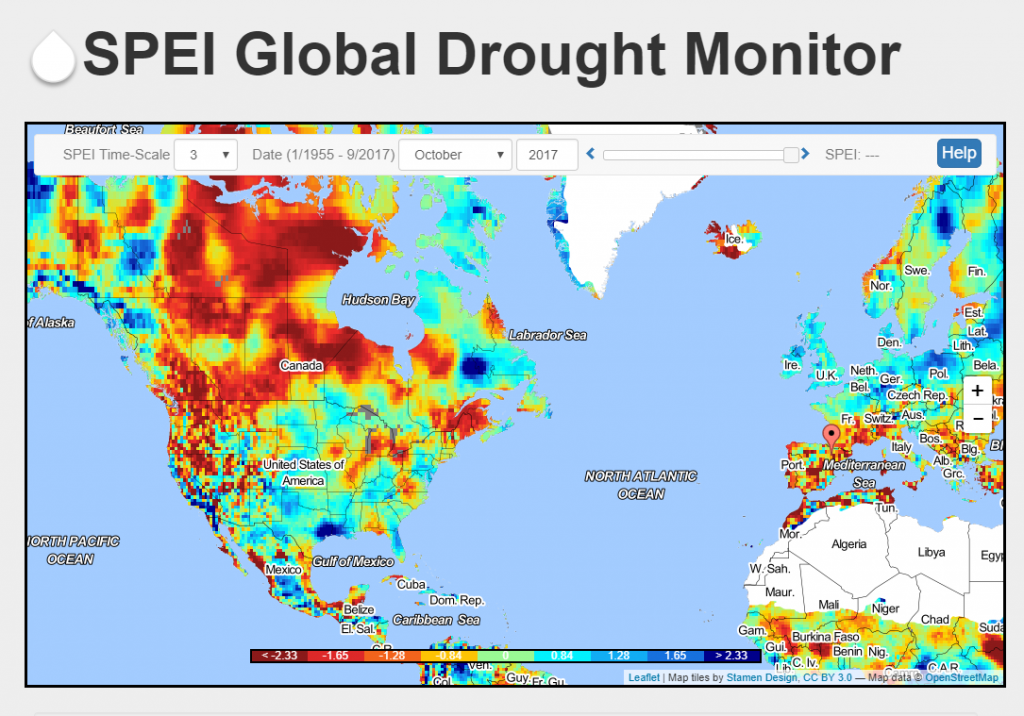
GLOBAL: Global Drought Monitor
This interactive global drought monitor offers information in real-time.
http://spei.csic.es/map/maps.html#months=1#month=8#year=2017
Italy Drought: Rome Forced to Cut Water Pressure at Night
This article from the BBC focuses on the drought affecting Italy in the summer of 2017. It explains some of the measures Roman authorities were forced to take to maintain the city’s water supply and highlights that people around the globe are experiencing and having to deal with droughts.
http://www.bbc.com/news/world-europe-41081066
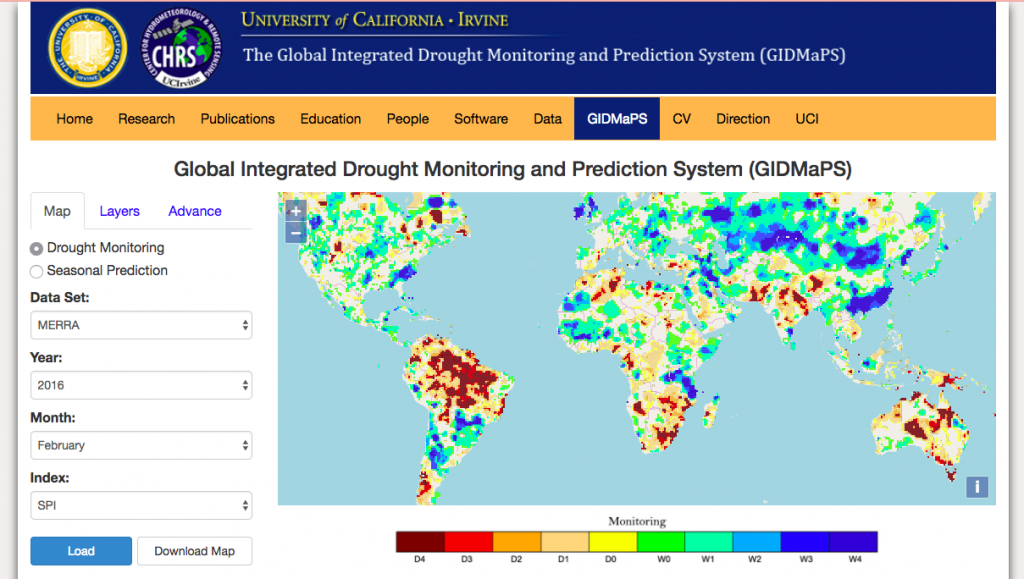
Global Integrated Droughts: The Global Integrated Drought Monitoring and Prediction System (GIDMaPS) is a drought monitoring and prediction system that provides near real-time drought information based on multiple drought indicators and input data sets.
Experts:
Solutions:
Tom Hader, Gaby Mendoza, Alex Martinez, Sal Lopez
