
Bundle 5: Iowa’s Changing Land Use
Tier 1: Changing Land Use
Tier 1: Changing Land Use
Objective:
The first objective of the Tier 1 Land Use activity is to engage the learner. This is accomplished by focusing on local land use change at the student’s home address or home town. In part two, the objective is to learn about watersheds. Finally, students are encouraged to investigate personal questions about land use.
Overview:
Teachers will guide the whole class in an initial investigation of current vs. historical land use using aerial photography. This section is designed to engage the learner in their local environment by having them ascertain the land use changes that have occurred in their home location. Students then set out to learn about watersheds and will investigate their local watershed. Later, students are set free to investigate their personal questions about land use in their local areas.
Big questions:
- What does it mean to develop land?
- What natural resources must a community use as their population grows?
- How does alteration of a landscape change the services associated with that land?
- What are the limitations on our consumption?
- What are our individual and societal needs, desires, and values? How do they manifest in natural resource use?
- How do humans benefit from ecosystem services?
- What are the scientific, economic, and social considerations for development?
Standards addressed:
| MS-ESS3-3 | Apply scientific principles to design a method for monitoring and minimizing a human impact on the environment. |
| MS-ESS3-4 | Construct an argument supported by evidence for how increases in human population and per-capita consumption of natural resources impact Earth’s systems. |
| MS-LS2-5 | Evaluate competing design solutions for maintaining biodiversity and ecosystem services. |
| MS-LS4-4 | Construct an explanation based on evidence that describes how genetic variations of traits in a population increase some individuals’ probability of surviving and reproducing in a specific environment. |
| MS-ESS2-4 | Develop a model to describe the cycling of water through Earth’s systems driven by energy from the sun and the force of gravity. |
| MS-PS1-3 | Gather and make sense of information to describe that synthetic materials come from natural resources and impact society. |
| MS-ETS1-1 | Define the criteria and constraints of a design problem with sufficient precision to ensure a successful solution, taking into account relevant scientific principles and potential impacts on people and the natural environment that may limit possible solutions. |
| MS-ETS1-2 | Evaluate competing design solutions using a systematic process to determine how well they meet the criteria and constraints of the problem. |
| MS-ETS1-3 | Analyze data from tests to determine similarities and differences among several design solutions to identify the best characteristics of each that can be combined into a new solution to better meet the criteria for success. |
| Science and Engineering | |
| Crosscutting Concepts |
Tier in depth:
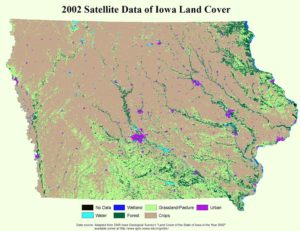
Tier 1 – Part I: Land Use: Iowa has a very extensively altered landscape, perhaps the most altered landscape of any state in the United States. Ninety-nine percent of native prairie and wetland is no longer present. These dramatic land use changes provide an exciting learning opportunity, where students can construct a history of local land use change. The initial engagement is accomplished by having students research this reality in the area they live in, or another Iowa location of interest to them (e.g., home neighborhood, park, town, county, family farm, where family members live or have lived). Students are encouraged to talk with parents, grandparents, historians, librarians, etc… to gain an understanding of how the area has been altered (soil, land surface, water, vegetation, other organisms, etc…) and why that alteration has taken place (social, economic, etc). Students are required to bring evidence, in the form of images, stories, graphs, tables, or other means to support their understanding. Students are encouraged to use sites such as: http://ortho.gis.iastate.edu/ (this site allows you to display photos as far back as far as 1836 and, using a slide tool, compare two images) and Google Earth to utilize aerial images of land use changes. Additionally, students will search for other resources that show how land use has changed over time. One starting point is: https://archaeology.uiowa.edu/government-land-office-survey-maps. However, students should be given space and freedom to determine what qualifies as a valuable resource, so further specific sources can be identified and utilized as a means of differentiation of instruction. (Maybe students even have historic pictures of the area, maybe taken by their parents, that could be shared). Students need to summarize how their selected area has changed over time, the reasons for the changes and the pros and cons of these changes.
 .
. 
Tier 1 – Part II: Watershed: Now that students have an understanding of how their land has changed, it is important to understand their area’s place in a watershed. There are many great ways to explore watersheds. One way is for students to utilize the website: http://ifis.iowafloodcenter.org/ifis/ to learn about watersheds, including what the definition of a watershed is, how defining a watershed boundary can be useful, and what the boundaries of their own watersheds are — specifically of the locations researched in Tier 1 – Part I.
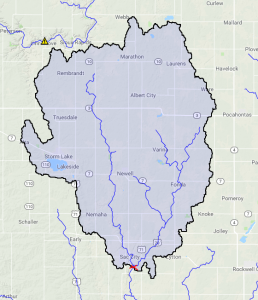
USING IFIS for watersheds: Go to the website: http://ifis.iowafloodcenter.org/ifis/ and then click on the “IFIS” button to launch the Flood Information System. Two tools within IFIS are best for thinking about watersheds. First is the “Raindrop Flow Tracker” which traces the route of rain in creeks and rivers until it leaves Iowa. And the second is the “Watershed Boundary” tool (output shown in the Figure below). One tool shows where rain goes from a specific point on the map. The other shows the what areas supply water to a specific point on the map.
To use the “Raindrop Flow Tracker,” zoom to your area of interest in Iowa. Then, on the right hand side, select the toolbox and select “Raindrop Flow Tracker”. Click on any location on the map and it will display the route for rain hitting that location to reach the nearest river/stream. To display watershed boundaries, within the same “Toolbox” location within IFIS, use “Find Watershed Boundary” to display watershed boundaries. Have students click on several locations within the area of interest to understand how the watershed boundaries change. Showing the watershed boundaries for a large creek or river should generate a large area as the watershed boundary (for example see the figure below), but it may take several clicks to select the right pixel to show the full watershed area. Watershed areas within towns and cities that may have stormwater ditches and underground drainage systems can also be interesting, but a bit challenging using IFIS. Finally, explore the website and look at the rainfall data, flow and flood issues of your area. This should develop into more questions that could be further researched as an extension possibility for Tier 1 – Part III.
One teaching approach for Tier 1, Part II is to have students make a list of people that would need to be involved in a team to solve flooding or water quality problems at a specific location, for example (as shown in the map below) at the joining point of the North Racoon River and Cedar Creek near Sac City, Iowa. Have student select a point on the map relevant to them and identify 5 stakeholders that would be needed to solve flooding issues, or water quality issues. This reinforces the idea of a watershed. Answers might include cities, towns, sewage treatment plants, parks, quarry operators, planners/designers/builders of buildings in the watershed, farmers, road maintenance crews, foresters, and many other land owners, land managers, and developers. This approach of team-based solutions to floods and water quality is being successful put in place in Iowa and other locations. See for example the Iowa Watershed Approach http://www.iowawatershedapproach.org/
An alternate activity is to make it a detective problem: if a contaminant was located in a specific waterway, where would the water quality detectives need to search to find the cause of the contamination? A real-world example of this was the 2014 Elk River spill in West Virginia, where smelly drinking water was noticed by residents of Charleston, West Virginia. The drinking water source was a nearby river, and the contamination was from leaking tanks at a factory in the watershed.
Part III: Water Quality: At this point, students should be highly tuned into their personal area. They will now be pushed to research the quality of the water in their particular region. Students will focus on Nitrate, Nitrite, Temperature, pH, Dissolved Oxygen, Specific Conductance, and Turbidity by using the data from the website: http://iwqis.iowawis.org. Step 1: On the right hand side, select “information panel” from the bottom ICON and turn on the “information panel”. This will provide students with a snapshot of information regarding the significance of each data item listed above. Step 2: Select the flask and determine what tests you’d like to run. In the sample shown here, we have selected Dissolved Oxygen. Students can then change the time scale, pull up other data, and even see images of the area where the testing station is located. Step 3: students will use the data, their understanding of watersheds, and their knowledge of how land use has changed to make a statement, supported by evidence, of their understanding of their local neighborhood. Collectively, they will gain an understanding of how people’s actions, both current and historically, have impacted the region where they live and play. One note: these data collection tools are more spread out around the state and students might have to use an ever larger watershed to get a glimpse of their region. This is a limitation but also an opportunity for students to test their home environment.
***EXTENSION POSSIBILITY: Have students collect their own water samples and determine it’s quality. Many of you have heard of or been trained in the IOWATER Program. The IOWATER program has gone through some changes due to “ongoing fiscal constraints” but there is a method to access the historical data for the state of Iowa.
The way to get to it (currently) is through the National Water Quality Portal Site: https://www.waterqualitydata.us/portal/
To get Iowa data, go to where it says “Location” and then “State”. Use the dropdown box to choose Iowa. Then scroll down to where it says “Data Source” and select “STORET”. Then, proceed to and select “Show Sites on Map”. From there, you can see what sites are “STORET”, which include both professional sites and IOWATER sites. You can zoom into the map and click on sites to download data. Anything with a IASNAPST (IOWATER snapshot or IOWATER) is volunteer collected data. Snapshot includes lab analysis.
For information on training, equipment and additional questions, contact Dr. Mary Skopec at Lakeside Lab.
Experts:
Breanna R. Shea
Iowa Flood Center Communications Specialist
Iowa Flood Center | University of Iowa
133-7 C. Maxwell Stanley Hydraulics Laboratory
Iowa City, Iowa 52242
Ph: 319-384-1729
Email: breanna-shea@uiowa.edu
Kate Giannini
Iowa Watershed Approach Communications Specialist
Iowa Flood Center | University of Iowa
133-4 C. Maxwell Stanley Hydraulics Laboratory
Iowa City, Iowa 52242
Ph: 319-335-5233
Email: kate-giannini@uiowa.edu
Dr. Mary Skopec
Executive Director of Iowa Lakeside Laboratory
Regents Resource Center
1838 Highway 86
Milford, IA 51351
Ph: 712-337-3669
Email: mary-skopec@uiowa.edu
