
Bundle 6: Climate
Tier 2, Part B: Soil and Soil Erosion
Tier 2, Part B: Soil and Soil Erosion
Objective:
Students investigate local climate issues, using real-world data.
Overview:
The goal of Tier 2 is to have students investigate local climate issues, using real-world data. Students will begin with a guided example, with a predetermined question, where they will investigate forcing (what is happening), then, what is the cause, the impact and finally, what can be done/should anything be done? A guided template is below, including resources, to help students with the first iteration. At the conclusion of this guided inquiry investigation, students will branch off into an open investigation. Students will be given a range of investigations, including open to their interest area, to explore and learn about. They will work in groups but be broken into jigsaw groups to make a consensus statement, supported by the data, with an overall climate statement.
Big questions:
- What is Soil erosion?
- What are nutrients plants need?
Standards addressed:
| MS-ESS2-4 | Develop a model to describe the cycling of water through Earth’s systems driven by energy from the sun and the force of gravity. |
| MS-ESS2-5 | Collect data to provide evidence for how the motions and complex interactions of air masses results in changes in weather conditions. |
| MS-ESS2-6 | Develop and use a model to describe how unequal heating and rotation of the Earth cause patterns of atmospheric and oceanic circulation that determine regional climates. |
| MS-ESS3-2 | Analyze and interpret data on natural hazards to forecast future catastrophic events and inform the development of technologies to mitigate their effects. |
| MS-ESS3-3 | Apply scientific principles to design a method for monitoring and minimizing a human impact on the environment. |
| MS-ESS3-4 | Construct an argument supported by evidence for how increases in human population and per-capita consumption of natural resources impact Earth’s systems. |
| MS-ESS3-5 | Ask questions to clarify evidence of the factors that have caused the rise in global temperatures over the past century. |
Tier in depth:
What is Soil erosion? What are nutrients plants need?
Background Knowledge: Soil erosion is a natural process that affects all landforms. It involves soil being worn down and moved, usually by way of water, wind, or in recent history, humans. Erosion is a big concern for humans, because we are highly dependent on agriculture for food. The amount of erosion dictates how much topsoil is present, which can then determine what crops can be planted on a given field, and the potential yields. There are a variety of different types of erosion within wind and water, and humans can impact the degree. A big part of the soil is the chemical nutrients that plants use within it. The most crucial nutrients plants depend on are nitrogen, phosphorus, and potassium.
http://www.omafra.gov.on.ca/english/engineer/facts/12-053.htm
Initial Engagement Activity:
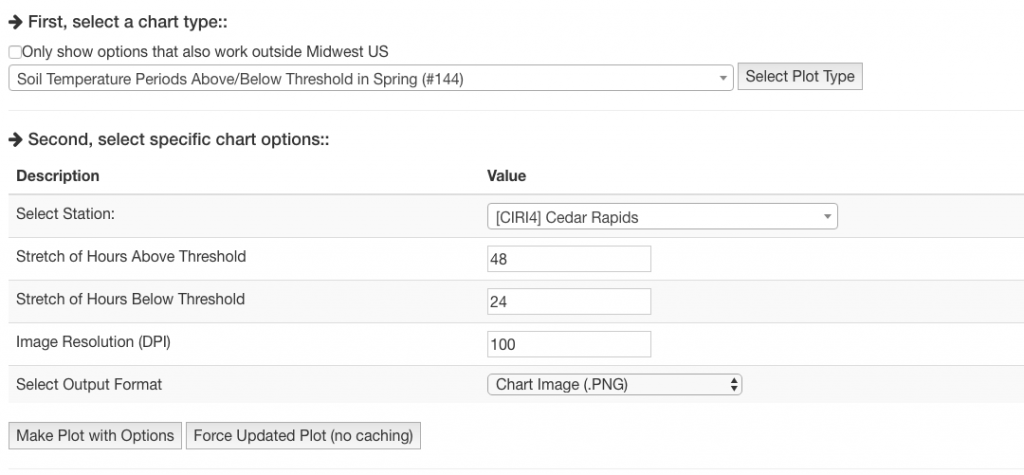
Open https://mesonet.agron.iastate.edu/plotting/auto/?q=144
-
Make plot #144 “Soil Temperature Above/Below Threshold in Spring”
-
Select “Select station” and pick a place local to you
-
Leave other settings unchanged
-
Click “Generate Plot with Options”
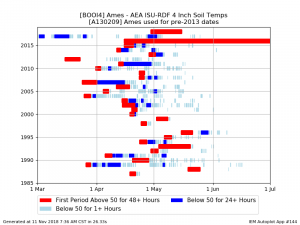
The data plot above shows the temperature of soil at a depth of 4 inches below the surface. Data is collected every hour via the Iowa State Soil Moisture Network. Going from left to right, and having the year on the vertical axis, is how this graph should have be read. The first occurrence of color laterally, in each row, is the first time the soil temperature at this location was above or at 50 degrees for a number of hours. Moving farther in the lateral direction, data is plotted that show soil temperature fluctuations. A red bar shows soil temperatures of 50 degrees F for the first period of 48 hours. The blue bar shows temperature of soil below 50 degrees F for a time period of 24 hours or more. The Light Teal color indicates that the temperature was below 50 degrees F for one plus hours.
Prompting Questions: What claims can you make using the evidence from these graphs and other sources you can find?
Alternative Initial Engagement Activity:
Landscape Powerpoint from Integrate (SERC): https://serc.carleton.edu/details/files/54652.html
Natural and Agricultural Erosion Rates: https://serc.carleton.edu/integrate/teaching_materials/sustain_agriculture/activity3.html
Iowa State PEWI: https://www.nrem.iastate.edu/pewi/
Basic PEWI Exercise: https://www.nrem.iastate.edu/pewi/files/lesson_plan/files/Basic%20PEWI%20Exercises_0.pdf
Climate Change and Soil Loss: https://serc.carleton.edu/integrate/teaching_materials/sustain_agriculture/activity5.html
List of Resources:
Iowa lost 15 million tons of soil to erosion:
Iowa’s soil is leaving the state and it is causing major financial problems for the farmers and business that rely on agriculture for their living. An Environmental working group estimates that 88,000 farmers will be affected by a 1 billion dollars in lost crop productions. A number of conservation practices are being implemented but still Iowa’s soil and nutrients are ending up in the Gulf of Mexico resulting in problems for the ecosystem.
Iowa NRCS Rainfall Simulator video (contact your local NRCS)
2011 Mississippi River Flood:
The 2011 Mississippi River flood was among the largest and most damaging to occur along this waterway in the past century. This video follows one group of scientists as they investigate sediment deposition in the wetlands of the Mississippi River delta plain. The results of this investigation will lead to a better understanding of how extreme flood events influence sedimentation in wetlands, and also will inform efforts to restore the deteriorating marshes of the Mississippi River Delta.
Chasing the Mud USGS video
Gulf hypoxia not as simple as it seems:
This article talks about the effects of nutrient runoff in Iowa has on bodies of water distant from the state. Oceanic dead zones are produced by the high concentration of nitrogen coming from Iowa and other states use of fertilizers and pesticides.
Article about soil loss and conservation in IA:
Picture below shows data of growing degree days, precipitation amounts, and temperature data in the state of Iowa. May 1st through October 10th.
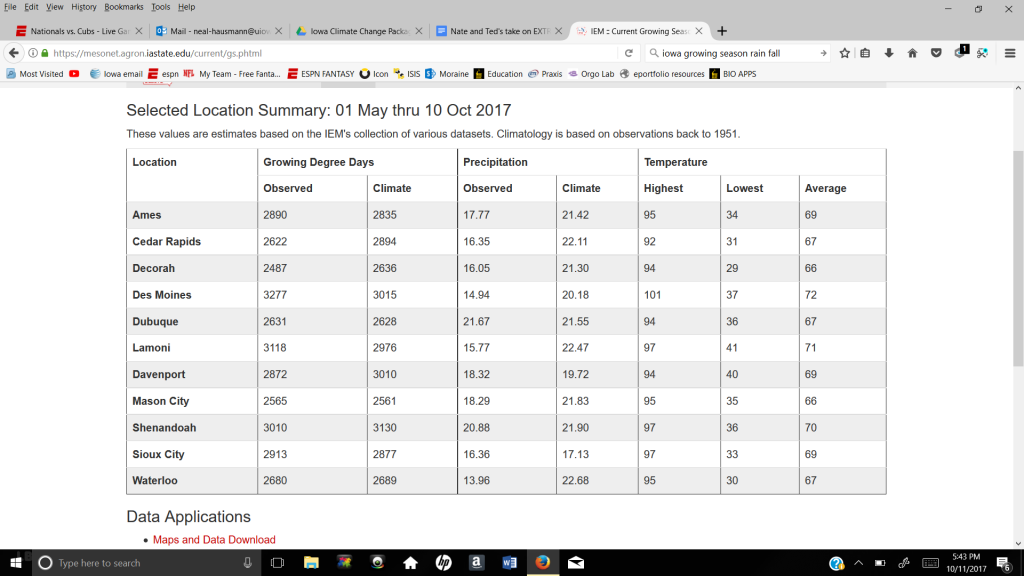
https://mesonet.agron.iastate.edu/current/gs.phtml
Expected Climate Change Impacts on Soil Erosion Rates: A Review
Compilation and review of studies of climate change on soil erosion and biome:
Soil Temperature in Cedar Rapids, Iowa:
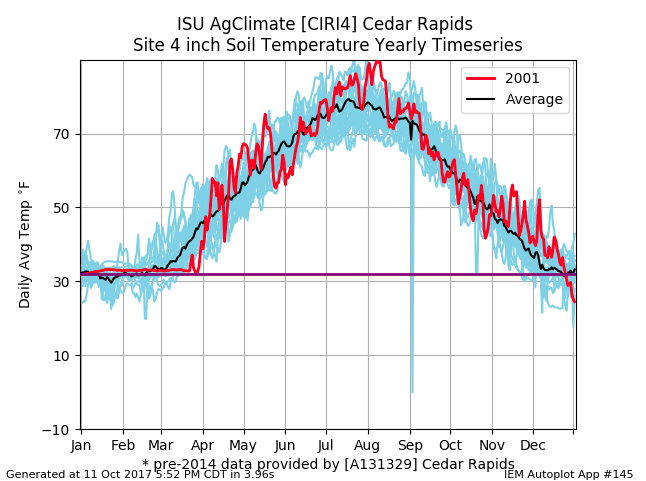
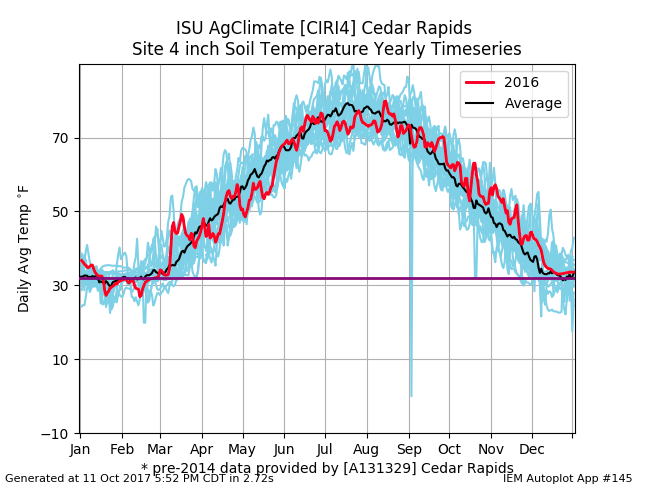
Cedar Rapids, Iowa soil temperature taken from the year 2001 and 2016. Data and Graphs were taken and generated using the Iowa State University Mesonet.
SERC Integrate Module on Soil: https://serc.carleton.edu/integrate/teaching_materials/sustain_agriculture/index.html
“This module uses real data to address soil sustainability in the context of land management and climate change.”
Experts:
Solutions:
