
Bundle 6: Climate
Tier 2, Part B: No more “snowy” holidays?
Tier 2: Part B: No more “snowy” holidays?
Objective:
Students investigate local climate issues, using real-world data.
Overview:
The goal of Tier 2 is to have students investigate local climate issues, using real-world data. Students will begin with a guided example, with a predetermined question, where they will investigate forcing (what is happening), then, what is the cause, the impact and finally, what can be done/should anything be done? A guided template is below, including resources, to help students with the first iteration. At the conclusion of this guided inquiry investigation, students will branch off into an open investigation. Students will be given a range of investigations, including open to their interest area, to explore and learn about. They will work in groups but be broken into jigsaw groups to make a consensus statement, supported by the data, with an overall climate statement.
Big questions:
- Has snowfall changed in Iowa, nationally and globally over the past 10 years resulting in less snow during the Holiday season?
Standards addressed:
| MS-ESS2-4 | Develop a model to describe the cycling of water through Earth’s systems driven by energy from the sun and the force of gravity. |
| MS-ESS2-5 | Collect data to provide evidence for how the motions and complex interactions of air masses results in changes in weather conditions. |
| MS-ESS2-6 | Develop and use a model to describe how unequal heating and rotation of the Earth cause patterns of atmospheric and oceanic circulation that determine regional climates. |
| MS-ESS3-4 | Construct an argument supported by evidence for how increases in human population and per-capita consumption of natural resources impact Earth’s systems. |
| MS-ESS3-5 | Ask questions to clarify evidence of the factors that have caused the rise in global temperatures over the past century. |
Tier in depth:
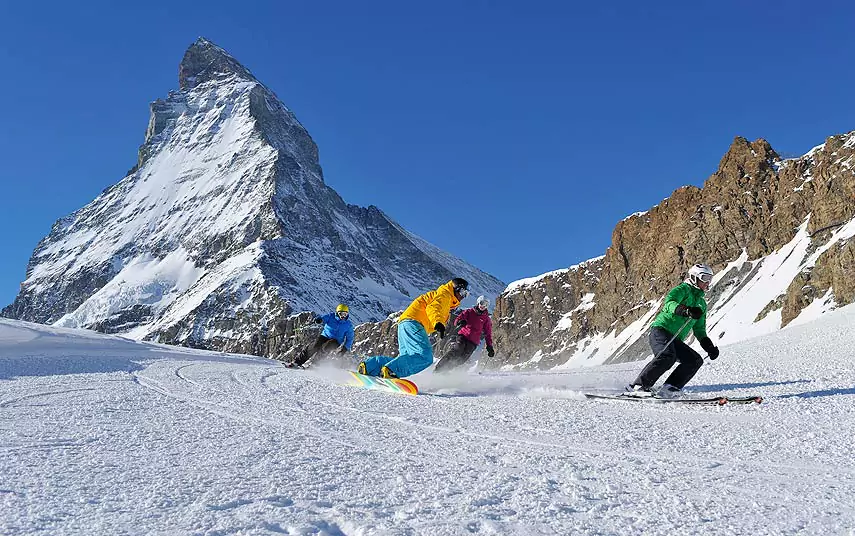
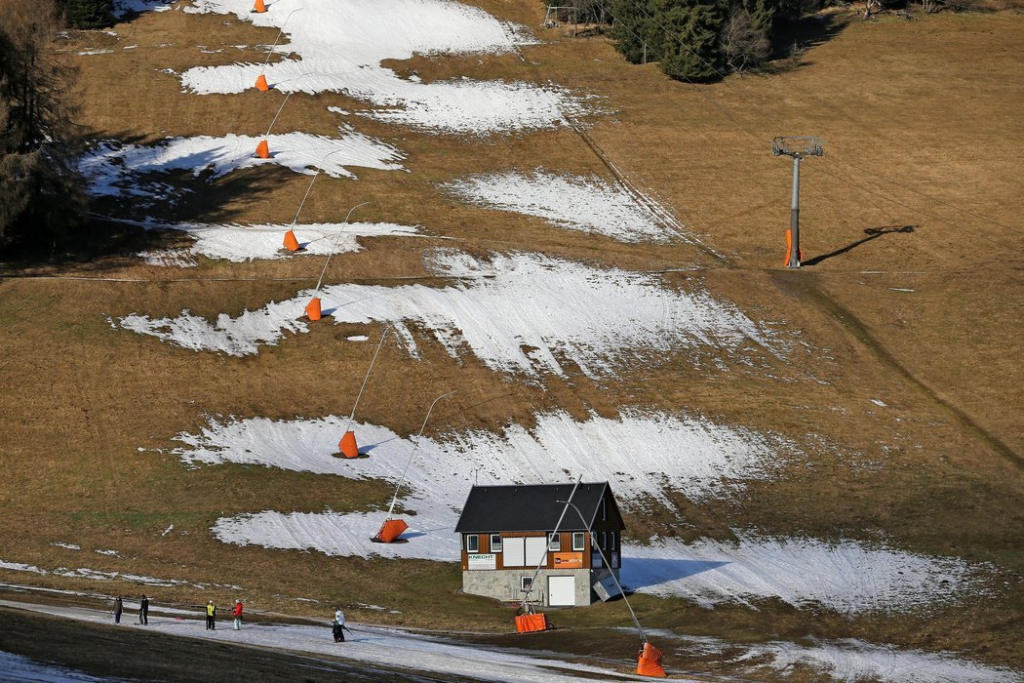
Background Knowledge: How many of us have happy memories of beautiful white fluffy snow covering the landscape on Christmas? It seems that the idyllic image of Christmas is incomplete without snow. However, each year it seems snow falls later and later and the chances of the perfect Christmas get smaller and smaller. So what’s going on? By looking at the snowfall data from several years in the past we can see exactly how much the winters in our country are changing. What could be causing this change?
Every day we are seeing the effects of global warming in our own backyard. Climate change has a diverse array of effects that can reach anywhere from the mountain tops, to here in Iowa. It is important to follow the changes in the world to predict future trends and prepare for a changing environment.
Many people know that water freezes at 32 degrees Fahrenheit. Once the temperature outside reaches that threshold we know to be on the lookout for snow. So what does global warming have to do with snow? When sunlight comes in and warms the surface of the Earth, some rays bounce back into space. Before they can reach outer space however, they must pass through the atmosphere which is composed of many different gases in various concentrations. Some of the gases prevent the sun’s rays from reaching space, and instead reflect them back down to the planet. This means Earth is warmed by rays directly from the sun, and ones that have been reflected back from the atmosphere. That’s a lot of rays! This has the effect of gradually warming the surface of the planet, making days much warmer than they have been in past years. If this is true, there would be fewer days below 32 degrees Fahrenheit which means fewer days with snow. Do you think we are in danger of no more snowy holidays?
Probing Question: Has snowfall changed in Iowa, nationally and globally over the past 10 years resulting in less snow during the Holiday season? Collect data to determine your answer to this question, using real-world data.
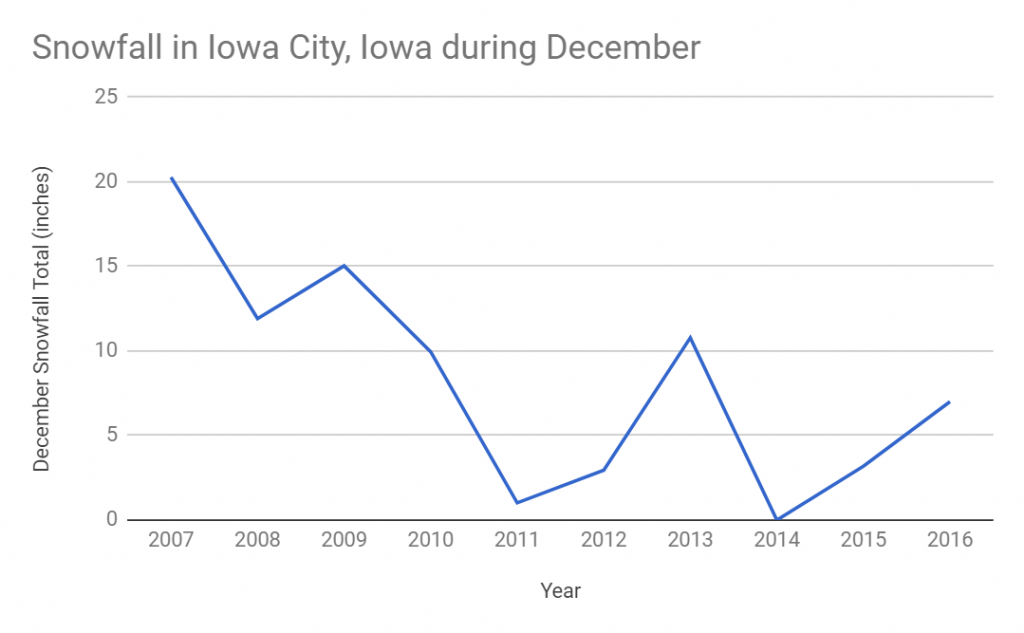
Investigation: One option is to look at the total amount of snowfall in December for any given city in Iowa.
Begin investigation:
-
Enter any city in Iowa in the search box at the top of the page.
-
Click on the History tab to look at data over the years.
-
Using the drop down menus, pick a year and the month of December and record that “Total Snowfall” amount found on the left side of the page.
-
Repeat these steps in order to collect the total snowfall amounts in December for your city for the past 10 years.
-
Once you have your data, create a depicting the total amounts of snowfall over the past ten years.
Example: Snowfall totals in December for Iowa City, Iowa.
| Year | December Totals in inches |
| 2007 | 20.27 |
| 2008 | 11.91 |
| 2009 | 15.03 |
| 2010 | 9.95 |
| 2011 | 1.02 |
| 2012 | 2.95 |
| 2013 | 10.78 |
| 2014 | 0 |
| 2015 | 3.19 |
| 2016 | 7 |
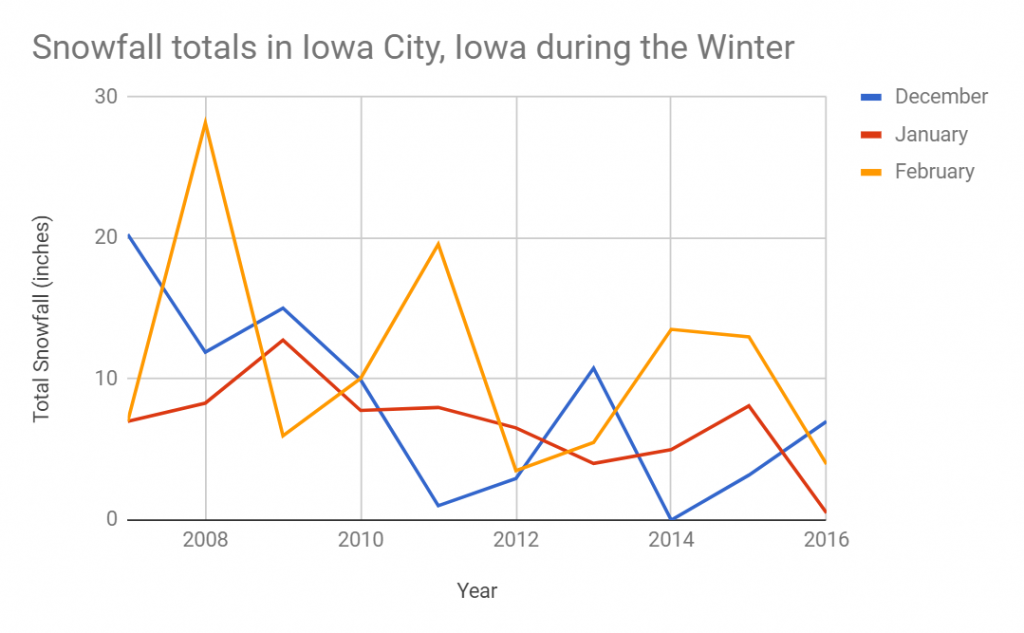
 More options: Students can also compare data for the months of December, January, and February.
 National/Global Viewpoint:
Introduce students to changes in snowfall across the nation, using this site: https://www.epa.gov/climate-indicators/climate-change-indicators-snowfall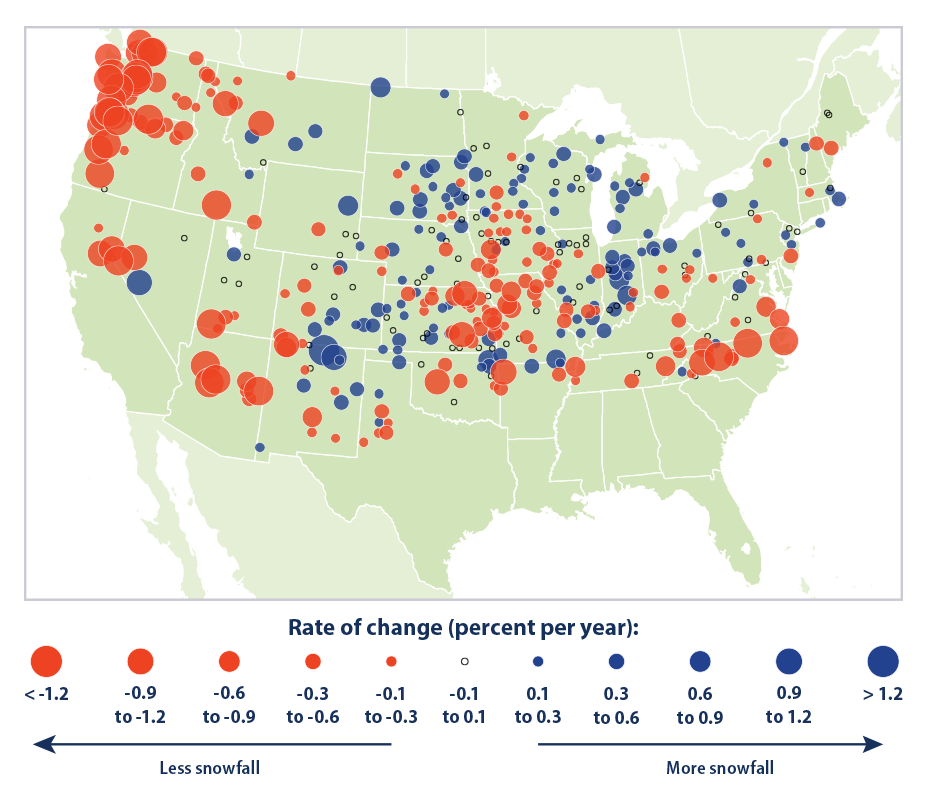
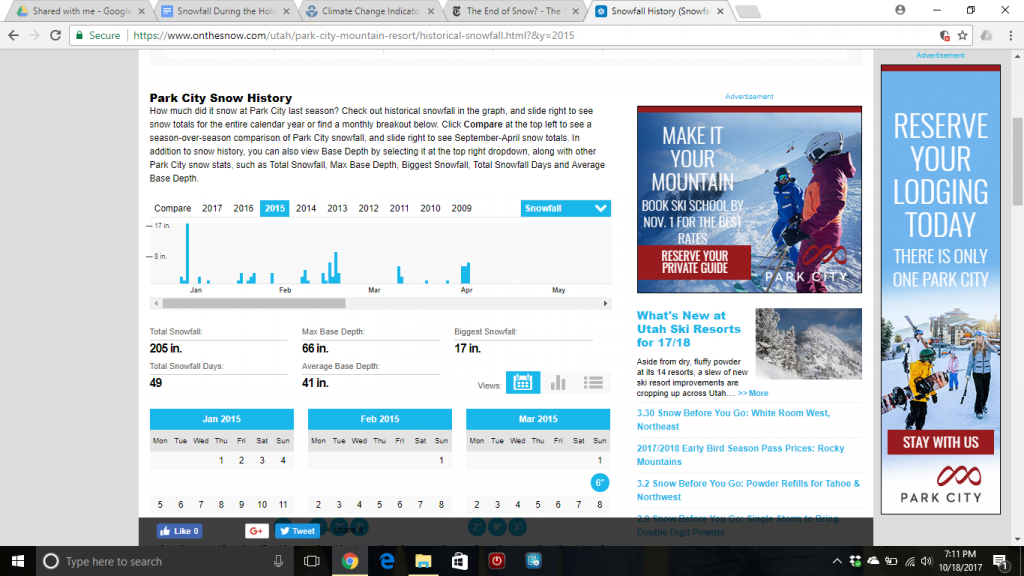
Students will then find their own data to test how snowfall has changed across the nation. Have students visit this website: http://www.onthesnow.com/.
Students select two specific ski resorts anywhere in the U.S.
Students click on the ‘Historical Snowfall’ tab. In this tab, students can view snowfall totals over the past 9 years.
Students create a graph for each selected location with snowfall totals over the past 9 years.
To introduce this concept globally, have students read this article about less snow fall in the Alps and the ski slopes in this region: http://www.telegraph.co.uk/travel/ski/news/climate-change-research-predicts-70-per-cent-less-snow-alps/
Last, have students read this article discussing decreasing amounts snowfall in regards to skiing over the past decades in response to climate change: https://www.nytimes.com/2014/02/08/opinion/sunday/the-end-of-snow.html
Students can compare/contrast the ideas in the article to their individual findings from part 2.
Article:
Minnesota. Maine. Upstate New York. The Allegheny Mountains of Pennsylvania and West Virginia. Practically anywhere in Idaho. And of course, the Rockies or the Sierra Nevada Mountains. These are the parts of the Lower 48* where weather history suggests you want to be if you’re looking for the best chance of a white Christmas.
The map at right shows the historic probability of there being at least 1 inch of snow on the ground in the Lower 48 states on December 25 based on the latest (1981-2010) U.S. Climate Normals from NOAA’s National Centers for Environmental Information (NCEI). The background map shows interpolated values for all locations. (Interpolating means estimating unknown values using known values and physical relationships, such as the way temperature is known to change with altitude.) You can also click and zoom in to specific stations used for the interpolation.
Darkest gray shows places where the probability is less than 10%. (Sorry West Coast, Gulf Coast, Deep South!) White shows probabilities greater than 90 percent.
The 1981–2010 Climate Normals are the latest three-decade averages of several climatological measurements. This collection contains daily and monthly normals of temperature, precipitation, snowfall, heating and cooling degree days, frost/freeze dates, and growing-degree days calculated from observations at approximately 9,800 stations operated by NOAA’s National Weather Service.
While the map shows the historical probability that a snow depth of at least one inch will be observed on December 25, the actual conditions in any year may vary widely from these because the weather patterns present will determine the snow on the ground or snowfall on Christmas day. These probabilities are useful as a guide only to show where snow on the ground is more likely. For prediction of your actual weather on Christmas Day, check out your local forecast at Weather.gov.
If you would like to keep track of the snowfall across the United States on a daily basis, see the National Operational Hydrologic Remote Sensing Center’s National Snow Analyses. For a more detailed assessment of the probability of a white Christmas as well as documentation of the methodology used to calculate the map’s underlying climatological statistics, see the scientific paper, White Christmas? An Application of NOAA’s 1981-2010 Daily Normals, by NCEI scientists and published in the Bulletin of the American Meteorological Society. You can also download a spreadsheet to see the full list of stations and their historic probabilities.
*The station network in Alaska is too sparse to allow scientists to interpolate with confidence.
This post was adapted from an article first published by the National Climatic Data Center. It was first published on December 11, 2013, and is reviewed each year and updated as needed.
Experts:
Solutions:
