
Bundle 6: Climate
Tier 2, Part B: 500 Year Floods
Tier 2, Part B: 500 Year Floods
Objective:
Students investigate local climate issues, using real-world data.
Overview:
The goal of Tier 2 is to have students investigate local climate issues, using real-world data. Students will begin with a guided example, with a predetermined question, where they will investigate forcing (what is happening), then, what is the cause, the impact and finally, what can be done/should anything be done? A guided template is below, including resources, to help students with the first iteration. At the conclusion of this guided inquiry investigation, students will branch off into an open investigation. Students will be given a range of investigations, including open to their interest area, to explore and learn about. They will work in groups but be broken into jigsaw groups to make a consensus statement, supported by the data, with an overall climate statement.
Big questions:
- What is a flood?
- What is the difference between a ‘100 year flood’ and a ‘500 year flood’?
- What causes flooding? What impacts does flooding have on humans? Alternatively, what impact do humans have on flooding?
- Do floods occur more frequently now than they did 100 years ago?
Standards addressed:
| MS-ESS2-4 | Develop a model to describe the cycling of water through Earth’s systems driven by energy from the sun and the force of gravity. |
| MS-ESS2-5 | Collect data to provide evidence for how the motions and complex interactions of air masses results in changes in weather conditions. |
| MS-ESS2-6 | Develop and use a model to describe how unequal heating and rotation of the Earth cause patterns of atmospheric and oceanic circulation that determine regional climates. |
| MS-ESS3-2 | Analyze and interpret data on natural hazards to forecast future catastrophic events and inform the development of technologies to mitigate their effects. |
| MS-ESS3-3 | Apply scientific principles to design a method for monitoring and minimizing a human impact on the environment. |
| MS-ESS3-4 | Construct an argument supported by evidence for how increases in human population and per-capita consumption of natural resources impact Earth’s systems. |
| MS-ESS3-5 | Ask questions to clarify evidence of the factors that have caused the rise in global temperatures over the past century. |
Tiers in depth:
Background info on 500 Year Floods:
Q:If a flood has a 100% chance of happening once every 500 years, what is the probability that it will happen in any given year?
A: 0.2%
Q:If a flood has a 100% chance of happening once every 100 years, what is the probability that it will happen in any given year?
A: 1%
Probing Question:
-
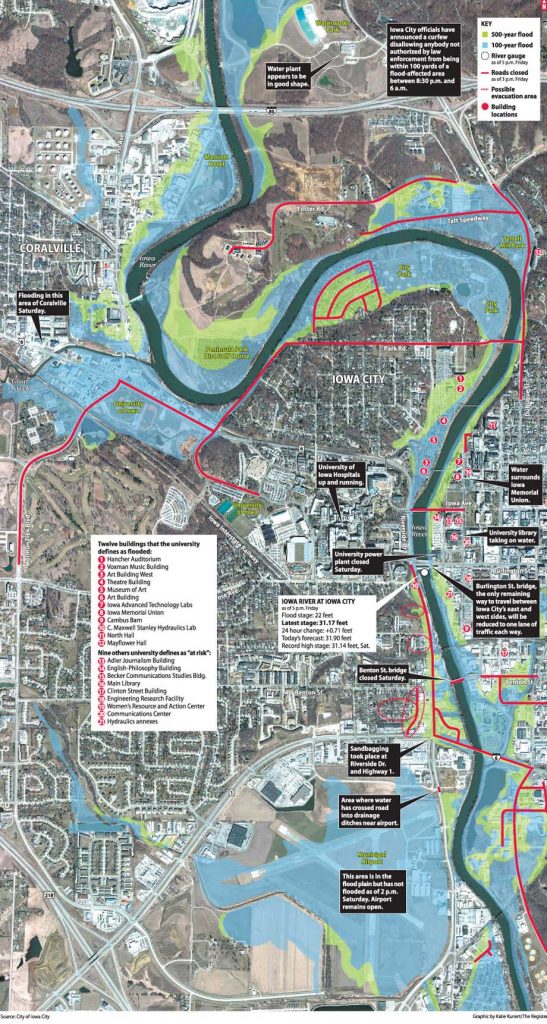
Based on the map below, what do you think is the probability of another set of 500 year floods in a period of 15 years? Can the population do anything to combat the high occurrence of 500 year floods in their area?
Initial Engagement Activity:
-
Have students brainstorm natural disasters and see if “floods” are brought up.
-
Explain how floods are natural disasters that are brought on by rain. The conditions for floods must be pretty perfect to be disastrous and damaging.
-
-
Use map of floodplains in iowa to explore 100 and 500 year floodplain maps throughout the state
-
Maps of Floodplains in Iowa: http://ifis.iowafloodcenter.org/ifis/maps/
-
How to use:
-
Pick a county in Iowa that experiences flooding. (Linn and Johnson Counties are good choices)
-
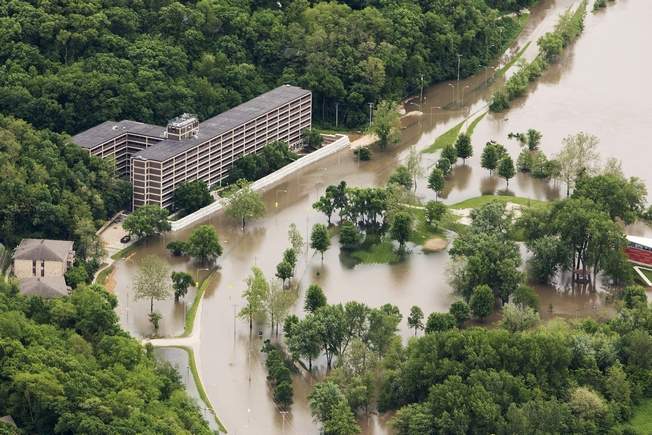
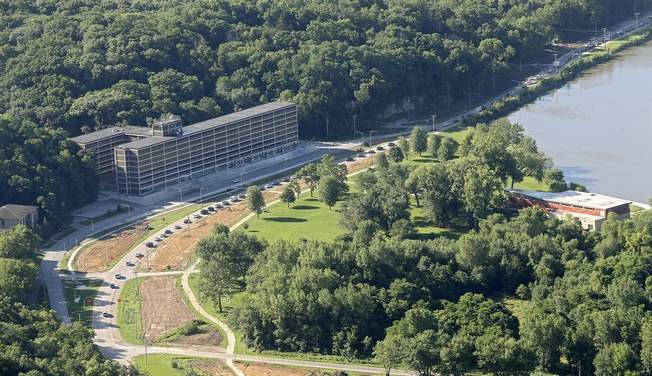
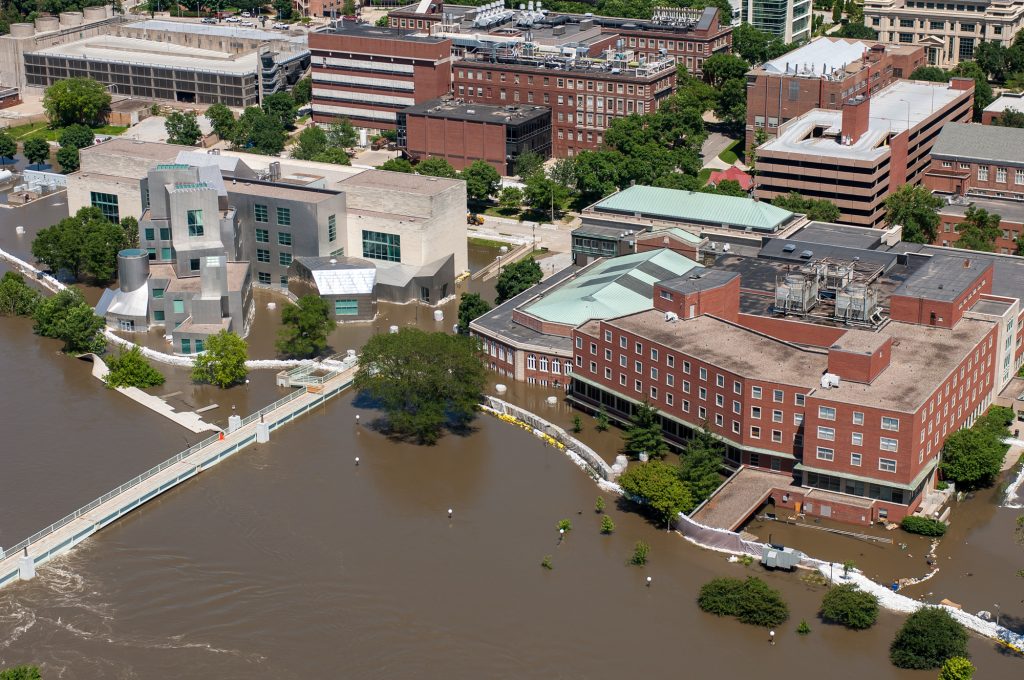
Have students zoom in until they can see the flood zones mapped. They should observe see what infrastructure may be affected. They can search specific addresses of buildings that have been affected by floods in the past (the IMU on the university of Iowa campus for example.)
-
Students can also discuss why the flood zones are shaped like they are. What land features contribute to this shape? What about built features like dams?
-
-
-
Discuss the implications, societal or environmental, of flooding
-
What caused these floods to happen
-
They can look into the 1993 or 2008 flood
-
-
Once they have established causes for flooding they can explore how one cause is changing the probability of floods. They can explore:
-
Increased precipitation
-
Streamflows
-
Resources:
What’s a flood?: This article talks about how floods are developed and how they can impact populations/areas that they affect.
http://www.nationalgeographic.com/environment/natural-disasters/floods/
Flood Occurrences Explained: This article explains that there are recurrence intervals of epic floods, how they work, and how they can impact populations.
https://water.usgs.gov/edu/100yearflood.html
Maps of Floodplains in Iowa:
http://ifis.iowafloodcenter.org/ifis/maps/
EPA information on Climate Change in Iowa: How climate change impacts heavy precipitation, flooding, tornadoes, and air pollution in the iowa area.
https://19january2017snapshot.epa.gov/sites/production/files/2016-09/documents/climate-change-ia.pdf
History of Top 5 Iowa Floods: Overview including causes, description, and impacts of the most disastrous floods in the state of Iowa.
http://www.crh.noaa.gov/Image/dmx/hydro/HistoricalIowaFloods_Top5.pdf
1993 Flood -What Happened?: Outlines the catalyst and impact of the great flood of 1993.
https://www.weather.gov/dvn/071993_greatflood
2008 Flood – What Happened?: Pictures, graphs,and maps depicting the unprecedented and historic midwest floods of 2008.
https://pubs.usgs.gov/pp/1775/pdf/pp1775.pdf
How Cedar Rapids population combatted flooding: Compares the flood of 2016 to the flood of 2008.
http://www.cnn.com/2016/09/27/us/iowa-wisconsin-flooding/index.html
Des Moines Register: Pictures of 2008 flood in Waterloo and Cedar Rapids
Cedar Rapids Gazette: Talks about how the close proximity of a nuclear power plant could prevent flood death.
Delhi Dam break: Talks about the rainfall event that flooded the Maquoketa River in Delaware County to the point that the Delhi Dam failed.
http://www.cnn.com/2010/US/07/24/iowa.dam.breach/index.html
https://www.cbsnews.com/news/iowas-lake-delhi-dam-bursts-due-to-flooding/
2008 Flood Pictures
http://stories-etc.com/Iowa_flood_08.htm
Mayflower – 1110 N. Dubuque St. Iowa City, Iowa 52245
http://www.thegazette.com/subject/news/government/iowa-flood-efforts-win-big-boost-20160121
IMU – 125 N. Madison St. Iowa City, IA 52245
https://now.uiowa.edu/2015/09/10-things-you-might-not-know-about-iowa-memorial-union
https://ostc.uiowa.edu/facilities/iowa-advanced-technology-laboratories

Experts:
Solutions:
